Datadog on DigitalOcean: Monitoring Droplets, DOKS, and More
Learn how to efficiently monitor your infrastructure with real-time metrics, alerts, and cost management strategies for optimal performance.
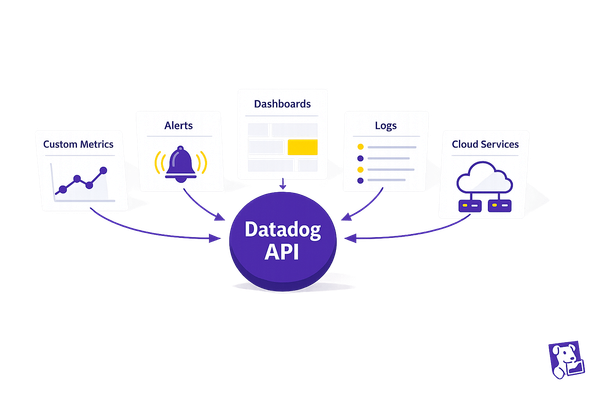
Datadog makes monitoring your DigitalOcean infrastructure simple and efficient. Here's what you can do:
- Track Droplets and DOKS clusters in real-time: Monitor CPU, memory, bandwidth, and more.
- Set up alerts: Get notified automatically when performance thresholds are breached.
- Visualize metrics: Use dashboards to analyze performance trends over time.
- Log and APM management: Troubleshoot issues fast with logs and application performance monitoring.
- Control costs: Optimize your monitoring expenses with tailored strategies.
Quick Setup:
- Install the Datadog Agent on new or existing Droplets.
- Use Helm charts to monitor Kubernetes clusters.
- Enable DigitalOcean API integration for complete visibility.
Datadog's tools help you maintain performance, troubleshoot faster, and manage costs effectively. Whether you're running Droplets or Kubernetes clusters, this guide walks you through setup and monitoring essentials, so your infrastructure stays efficient and reliable.
Datadog Log Monitoring in 5 minutes | Effortlessly Monitor Logs on Your Linux Machine with Datadog
Initial Datadog Setup for DigitalOcean
Getting Datadog monitoring up and running for your DigitalOcean setup involves three main tasks: installing the Datadog Agent on your Droplets, setting up DOKS integration for Kubernetes clusters, and connecting the DigitalOcean API.
Installing the Datadog Agent on Droplets
For new Droplets, you can enable monitoring directly from the control panel when creating them. If you're working with existing Droplets, there are two ways to install the Datadog Agent:
-
Quick Installation Script
Run this command as root or with sudo privileges:
curl -sSL https://repos.insights.digitalocean.com/install.sh | sudo bash -
Manual Repository Setup (for Debian/Ubuntu systems)
Use the following steps to manually configure the repository and install the agent:
echo "deb https://repos.insights.digitalocean.com/apt/do-agent/ main main" | sudo tee /etc/apt/sources.list.d/digitalocean-agent.list
curl https://repos.insights.digitalocean.com/sonar-agent.asc | sudo apt-key add -
sudo apt-get update && sudo apt-get install do-agent
To confirm that the agent is running, check its status with:
ps aux | grep do-agent
Once Droplet monitoring is set, you're ready to configure Datadog for your Kubernetes clusters.
Setting Up DOKS Integration
After enabling monitoring on your Droplets, you can extend it to your Kubernetes clusters. To deploy the Datadog Agent, use Helm charts by following these steps:
- Add the Datadog Helm repository.
- Create a custom values file to define your configuration.
- Install the Datadog Agent using Helm.
To ensure continuity, configure persistent storage for the Datadog Agent. This will allow it to retain historical data even if pods restart.
Configuring the DigitalOcean API
Integrating the DigitalOcean API with Datadog lets you monitor Droplet resource usage and get a complete view of your infrastructure's health.
"DigitalOcean Monitoring enables real-time tracking and alerting via email or Slack".
Starting in April 2025, DigitalOcean improved its installation process. Once the agent is deployed, you'll immediately see detailed graphs in your control panel. These graphs are displayed in your local timezone, making it easier to monitor your infrastructure.
Essential Metrics for DigitalOcean
Keeping a close eye on key performance indicators (KPIs) for Droplets and DigitalOcean Kubernetes Service (DOKS) clusters is crucial for maintaining optimal performance.
Droplet Performance Metrics
When monitoring Droplets, focus on six essential metrics:
- CPU Usage: Measures the processing power consumed by user tasks and system operations.
- Bandwidth: Tracks network traffic on both public and private connections.
- Disk I/O: Monitors the speed and frequency of read and write operations.
- Memory Usage: Reflects how much RAM is in use and its allocation patterns.
- Disk Usage: Keeps tabs on how much storage space is being utilized.
- Load Average: Provides an overview of system-wide resource demand.
The performance dashboard offers multiple time frames for analysis, including 6-hour, 24-hour, 7-day, and 14-day views. For a deeper dive, let’s look at metrics specific to DOKS clusters.
DOKS Health Metrics
Monitoring DOKS clusters can be more challenging due to the distributed nature of containerized applications. Thankfully, the kube-prometheus stack simplifies this with a robust set of tools:
| Component | Primary Function | Key Metrics |
|---|---|---|
| Prometheus Operator | Core monitoring | Cluster-wide metrics |
| kube-state-metrics | Tracks resource states | Pod and node statuses |
| Node Exporters | Hardware monitoring | CPU, memory, network |
| Metrics API | Performance tracking | API response times |
| Alerts Manager | Manages notifications | Alert status and history |
For precise monitoring, you can use a ServiceMonitor along with PromQL queries.
Building Custom Metrics
Custom metrics allow you to track unique aspects of your environment. Tools like the Datadog agent treat these metrics just like built-in system metrics, making them perfect for tailored monitoring needs.
Here are some key application performance metrics to consider:
- HTTP Error %: Tracks the percentage of failed HTTP requests.
- Request Rate: Measures the number of incoming requests per second.
- Average Response Time: Reflects how long it takes to process requests.
- Thrown Exceptions: Counts errors occurring during execution.
To implement custom metrics, use DogStatsD with the following parameters:
- METRIC_NAME: A unique identifier for the metric.
- METRIC_VALUE: The actual measurement being tracked.
- SAMPLE_RATE: How frequently data is collected.
- TAGS: Contextual labels for better organization.
The Datadog agent automatically flushes data every 10 seconds, ensuring near real-time insights into your system's performance.
Professional Monitoring Methods
Log Collection and Review
Datadog's Log Management system is designed to quickly spot patterns in logs and automatically link them with metrics. This approach simplifies troubleshooting and minimizes the need for manual log parsing. Impressively, some Datadog users handle up to 12 billion log events daily while keeping costs under control.
To get the most out of log management, consider these practices:
- Enable unified tagging: Use consistent tags across your DigitalOcean infrastructure to make filtering and searching easier.
- Create custom dashboards: Take advantage of drag-and-drop tools to craft real-time log analytics views.
- Configure retention policies: Set tailored retention periods for different log types to balance storage costs effectively.
For deeper insights into your applications, pair log management with Application Performance Monitoring (APM).
APM Implementation
Integrating APM into your monitoring strategy provides a closer look at your workloads. With auto-tagging, performance data is automatically linked to the right services and infrastructure components. Here's a breakdown of key APM features and their benefits:
| Monitoring Focus | Key Benefits | Impact |
|---|---|---|
| Service Maps | Visualize dependencies | Pinpoint bottlenecks |
| Trace Analytics | Track request flows | Reduce latency |
| Error Tracking | Capture exceptions | Enhance reliability |
| Resource Profiling | Monitor resource usage | Improve performance |
Datadog APM can even bring down the mean time to resolution (MTTR) for production issues to under two minutes. Pair these performance insights with cost tracking to ensure your DigitalOcean environment runs efficiently.
Cost Tracking and Management
Keeping costs under control while maintaining strong performance is crucial. Datadog's Cloud Cost Management feature merges cost data with observability metrics, giving you a clear view of your spending on DigitalOcean.
To manage costs effectively:
- Set up spike alerts: Get notified about sudden usage increases that might affect your billing.
- Audit tag usage: Regularly review and clean up unused tags to avoid collecting unnecessary data.
- Optimize log retention: Use Flex Logs to maintain flexible querying capabilities while managing storage costs.
Datadog also provides automated recommendations to identify orphaned resources, modernize outdated components, and right-size underused resources. With these strategies, some organizations have cut their cloud costs by as much as 50%.
Conclusion: Best Practices for DigitalOcean Monitoring
Keeping an eye on your DigitalOcean setup is all about striking the right balance between performance and cost. With global cloud spending projected to surpass $723 billion by 2025, small and medium-sized businesses (SMBs) must adopt efficient and budget-friendly monitoring strategies.
Here’s how to get the most out of Datadog for monitoring DigitalOcean:
Start by refining your data management. Pre-aggregating metrics and filtering logs at the source can significantly reduce the amount of data ingested. For development environments, log sampling and exclusion filters are smart ways to manage storage costs without losing sight of critical system insights.
When it comes to resource allocation, focus on efficiency. Consolidate workloads onto fewer instances whenever possible, and explore container-based pricing models for added flexibility. In DigitalOcean Kubernetes Service (DOKS) environments, optimizing pod density and using autoscalers like Karpenter can help you make the most of your resources.
To keep Datadog usage under control, adopt a structured approach:
| Monitoring Component | Monthly Cost | Optimization Strategy |
|---|---|---|
| Infrastructure | $15/host | Consolidate workloads |
| APM | $31/host | Prioritize monitoring critical services |
| Log Management | $0.10/GB | Use log sampling |
| RUM | $1.50/1K sessions | Focus on essential user paths |
Regularly auditing your metrics is another key step. Eliminate unnecessary data, take advantage of committed discounts, and ensure your monitoring efforts align with your broader Datadog strategy. By following these practices, you’ll keep your DigitalOcean environment performing at its best without breaking the bank.
FAQs
How can Datadog help DigitalOcean users reduce and manage monitoring costs effectively?
Datadog helps DigitalOcean users keep monitoring costs in check with its customizable dashboards and flexible pricing options designed to match individual requirements. By focusing on the most essential metrics and resources, it eliminates unnecessary data collection, cutting down on extra expenses.
On top of that, Datadog’s alerting features ensure you stay on top of the key performance indicators (KPIs) that matter most. Its seamless integration with DigitalOcean services makes resource tracking more efficient. This focused approach not only reduces waste but also allows you to allocate your budget wisely without compromising system performance.
What essential performance metrics should I monitor with Datadog for DigitalOcean Droplets and DOKS clusters?
When using Datadog to keep an eye on your DigitalOcean Droplets and DOKS clusters, focusing on the right performance metrics is key to ensuring everything runs smoothly. Here are the areas you should pay attention to:
- CPU and memory usage: Keeping tabs on resource usage helps confirm that your Droplets and Kubernetes nodes are staying within healthy operational limits.
- Disk I/O and network performance: Monitor how fast data is being read and written, along with network traffic, to spot any bottlenecks or connectivity hiccups.
- Pod and container health: For DOKS clusters, it's crucial to track pod statuses, container restarts, and resource limits to ensure applications remain stable and responsive.
- Custom application metrics: Leverage Datadog integrations to gather app-specific data like request latency or error rates. These insights can reveal deeper performance trends.
Regularly reviewing these metrics allows you to tackle potential problems early, fine-tune resource usage, and keep your DigitalOcean setup running efficiently - just the way you need it.
How do I set up persistent data storage for the Datadog Agent when using Helm on Kubernetes?
To set up persistent data storage for the Datadog Agent on Kubernetes using Helm, you’ll need to configure Persistent Volumes (PVs) and Persistent Volume Claims (PVCs). Think of PVCs as the requests for storage, while PVs are the actual storage resources available in your cluster.
If you want storage to be provisioned automatically, Storage Classes come in handy. They let you define parameters like storage size or performance and handle the allocation process seamlessly. This setup ensures your data stays intact and accessible, even if pods are restarted or moved within the cluster.

