Fix Log Parsing Errors in Datadog
Troubleshoot Datadog log parsing by validating sources, fixing Grok/regex and timestamp issues, testing in Log Explorer, and monitoring parsing error metrics.
Log parsing errors in Datadog lead to unstructured logs, making monitoring and troubleshooting harder. These issues often arise from mismatched Grok patterns, timestamp problems, or misconfigured pipelines. Here’s how to fix them:
- Identify Issues: Look for logs dumped into a single
messagefield, incorrect timestamps, or silent parsing failures. - Check Configurations: Validate log source settings, permissions, and file encodings. Ensure pipelines and Grok patterns align with your log format.
- Debug Grok Patterns: Start with broad matches and refine patterns using Datadog’s tools. Test with various log samples to account for edge cases.
- Monitor Fixes: Use metrics like
datadog.pipelines.parsing_errorand real-time tools like Live Tail to ensure logs are parsed correctly.
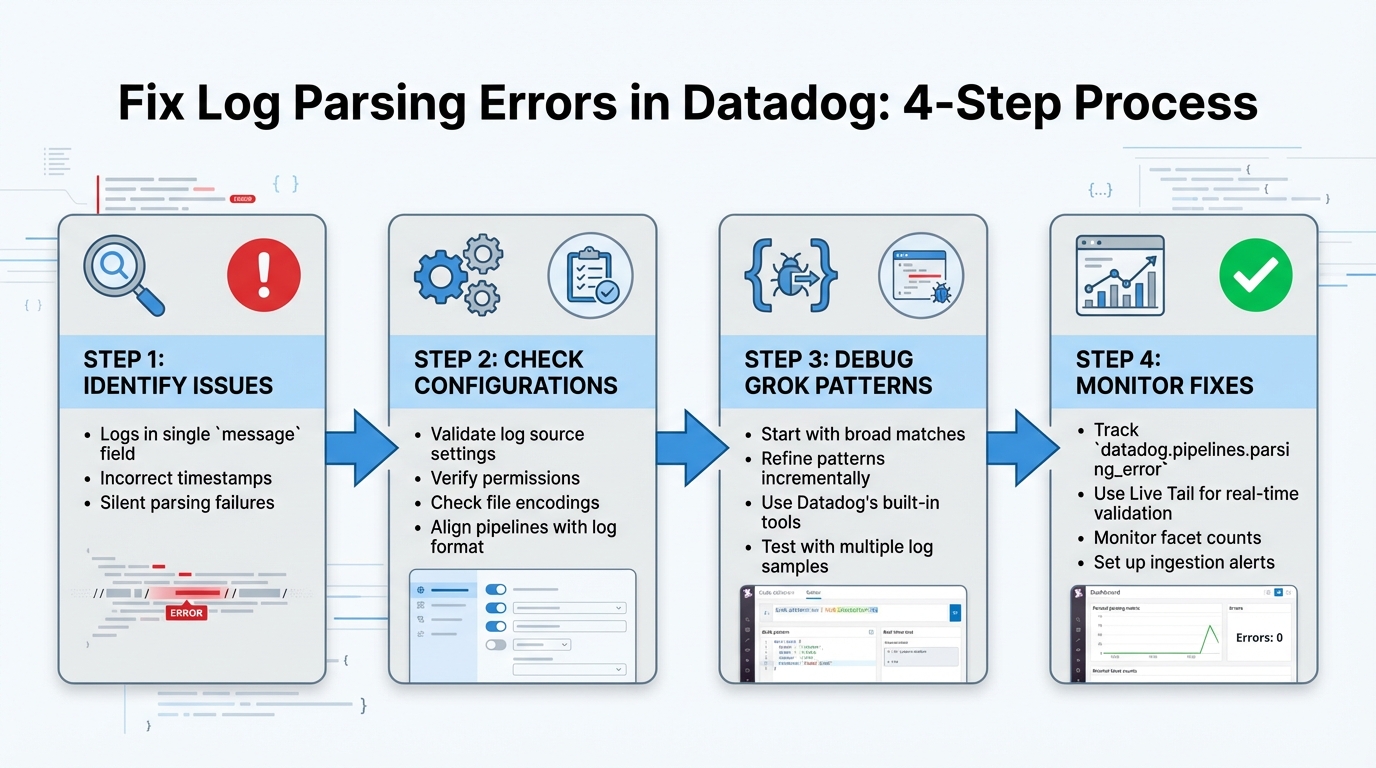
4-Step Process to Fix Datadog Log Parsing Errors
Use Grok parsing to extract fields from logs | Datadog Tips & Tricks
How to Identify Common Log Parsing Errors
Catching log parsing errors early can save you from bigger monitoring headaches down the road. These errors can sometimes be subtle, but knowing the telltale signs can make all the difference.
Unparsed Logs and Missing Fields
If you see logs where all the data is crammed into a single message field instead of being broken into structured fields like http.status_code or user_id, it’s a clear sign of a parsing failure. Instead of neatly organized attributes, the log appears as raw text, making it tough to work with.
To uncover these issues, try negative queries in the Log Explorer. For instance, the query source:nginx -@http.status_code:* will show nginx logs missing the http.status_code field. Without properly structured fields, tasks like filtering, grouping, or aggregating your data become much harder.
Incorrect Timestamp Recognition
Timestamp problems are trickier to spot but can cause major confusion. When Datadog can’t parse a log's timestamp, it defaults to the time the log was ingested rather than the actual event time. This can throw off your timeline, making logs appear out of order and complicating incident investigations.
To verify timestamps, inspect each log entry’s JSON to see if the timestamp reflects the event time or defaults to ingestion time. Time zone mismatches can also create problems, with logs from different systems showing times that are hours apart, further distorting event tracking.
Once you've addressed timestamp inconsistencies, it’s important to check for parsing errors that might not be immediately obvious.
Silent Parsing Failures
Some parsing errors happen quietly, without any explicit warnings. For example, if a Grok pattern doesn’t match, Datadog will still ingest the log but leave it as unstructured text. This silence can disrupt monitors and dashboards that depend on extracted data.
You might notice silent failures when dashboards stop updating or alerts fail to trigger. One way to catch these issues is by monitoring facet counts - if your overall log volume remains steady but the count of structured facets drops, it’s a red flag. Identifying and fixing these silent failures quickly can prevent bigger problems from developing.
How to Troubleshoot Log Parsing Configuration
When dealing with parsing errors, it's important to dig into your configuration settings to pinpoint the root cause. Here’s a step-by-step guide to help you resolve common issues by reviewing each layer of your configuration.
Validate Log Source Configuration
First, ensure that log collection is enabled. Check your datadog.yaml file for the line logs_enabled: true. Without this setting, the Agent won’t collect logs, no matter how well other configurations are set up.
Next, run the command sudo datadog-agent status in your terminal. This provides a snapshot of active log sources and highlights errors like "File not found" or "Permission denied." Double-check that your source and service tags are properly defined - especially the source tag, as it directs Datadog to the correct integration pipeline for parsing.
If logs still aren’t showing up, examine the Agent’s log file located at /var/log/datadog/agent.log for ingestion errors. Confirm that the file paths in your configuration align with the actual location of your log files. Additionally, in the Log Explorer, search for datadog.pipelines.parsing_error or status:error to identify logs that were ingested but failed during pipeline processing.
Check Encoding and Permissions
The Datadog Agent typically operates under the dd-agent user on Linux, so it must have the necessary permissions to access log files. While permission errors might not appear in the Datadog UI, they are often detailed in the Agent’s status output or local logs.
To verify permissions, use the command ls -l /path/to/your/log/file. If the dd-agent user or group lacks read access, you can use chmod or chown to grant the required permissions. Ensure that dd-agent has read access to the log files and execute permissions for all parent directories.
Encoding issues can also disrupt log parsing. Use the command file -i <filename> to check the file's encoding. Datadog requires logs to be in UTF-8. If your logs are in another format, like UTF-16, the Agent may fail to process them or produce unreadable text. To fix this, either convert the logs to UTF-8 at their source or specify the encoding in your conf.yaml file using the encoding attribute.
Review Pipeline and Parsing Rules
Logs are processed through Datadog pipelines in a specific sequence. Each log is handled by the first pipeline whose filter criteria it matches. To troubleshoot, navigate to Logs > Configuration > Pipelines and review the filters in your pipelines. Confirm that the source or service tags of your unparsed logs align with the pipeline’s filter.
Keep in mind that the order of pipelines matters. If a generic pipeline is positioned above a more specific one, it could intercept logs that should be handled by the specific pipeline. Arrange your pipelines so that more specific ones are prioritized above generic ones.
To isolate parsing errors, use the Grok Parser's "Test" feature to identify mismatches in your patterns. You can also run a search query in the Log Explorer, such as source:<SOURCE_NAME> _parsing_error:*, to find logs that are reaching the correct pipeline but failing to parse. If a log is only partially parsed, adjust your Grok patterns to account for variations in the log fields.
How to Fix Grok Parsing and Regex Issues
Debug Grok Patterns
Begin with a simple wildcard pattern like .* to confirm that your log entry is being captured. Once you’ve established a baseline match, gradually replace parts of the wildcard with more specific grok patterns that target individual fields. Datadog’s built-in library of patterns, such as %{IP:client_ip} for IP addresses or %{NUMBER:duration} for numeric values, can help minimize custom regex mistakes. Tools like the Grok Parser UI and Pipeline Preview are extremely useful for visualizing your log processing flow and ensuring your patterns align with the intended pipeline.
When working with regex, remember to escape special characters (e.g., ., *, +, ?, |, (, ), [, ], {, }, ^, and \) so they are treated as literals. Using anchors like ^ (start of the line) and $ (end of the line) can also help ensure your pattern matches the entire log message accurately. Once you’ve created a basic match, refine your regex to improve its precision.
Improve Regex Accuracy
After confirming your initial pattern works, focus on refining it to prevent over-capturing. Avoid using overly broad matchers like .*, which can unintentionally grab more data than intended. Instead, opt for more focused matchers such as \S+ for non-whitespace characters. If you need to account for variable spacing, use \s or \s+ instead of hardcoding spaces.
Consistent field naming is key for better organization and searchability. Use clear and descriptive names like http.status_code or service.name to make your parsed data easier to work with. For logs where certain fields may be optional, incorporate the ? quantifier or create alternate parsing rules to handle variations without breaking the pattern.
If your logs include unnecessary trailing text, adjust your pattern to exclude it. Finally, test your refined grok patterns with a variety of log samples in Datadog’s Log Explorer to ensure they work effectively across different formats and edge cases. This approach helps you create reliable and accurate parsing rules.
How to Test and Validate Your Fixes
Use the Datadog Log Explorer
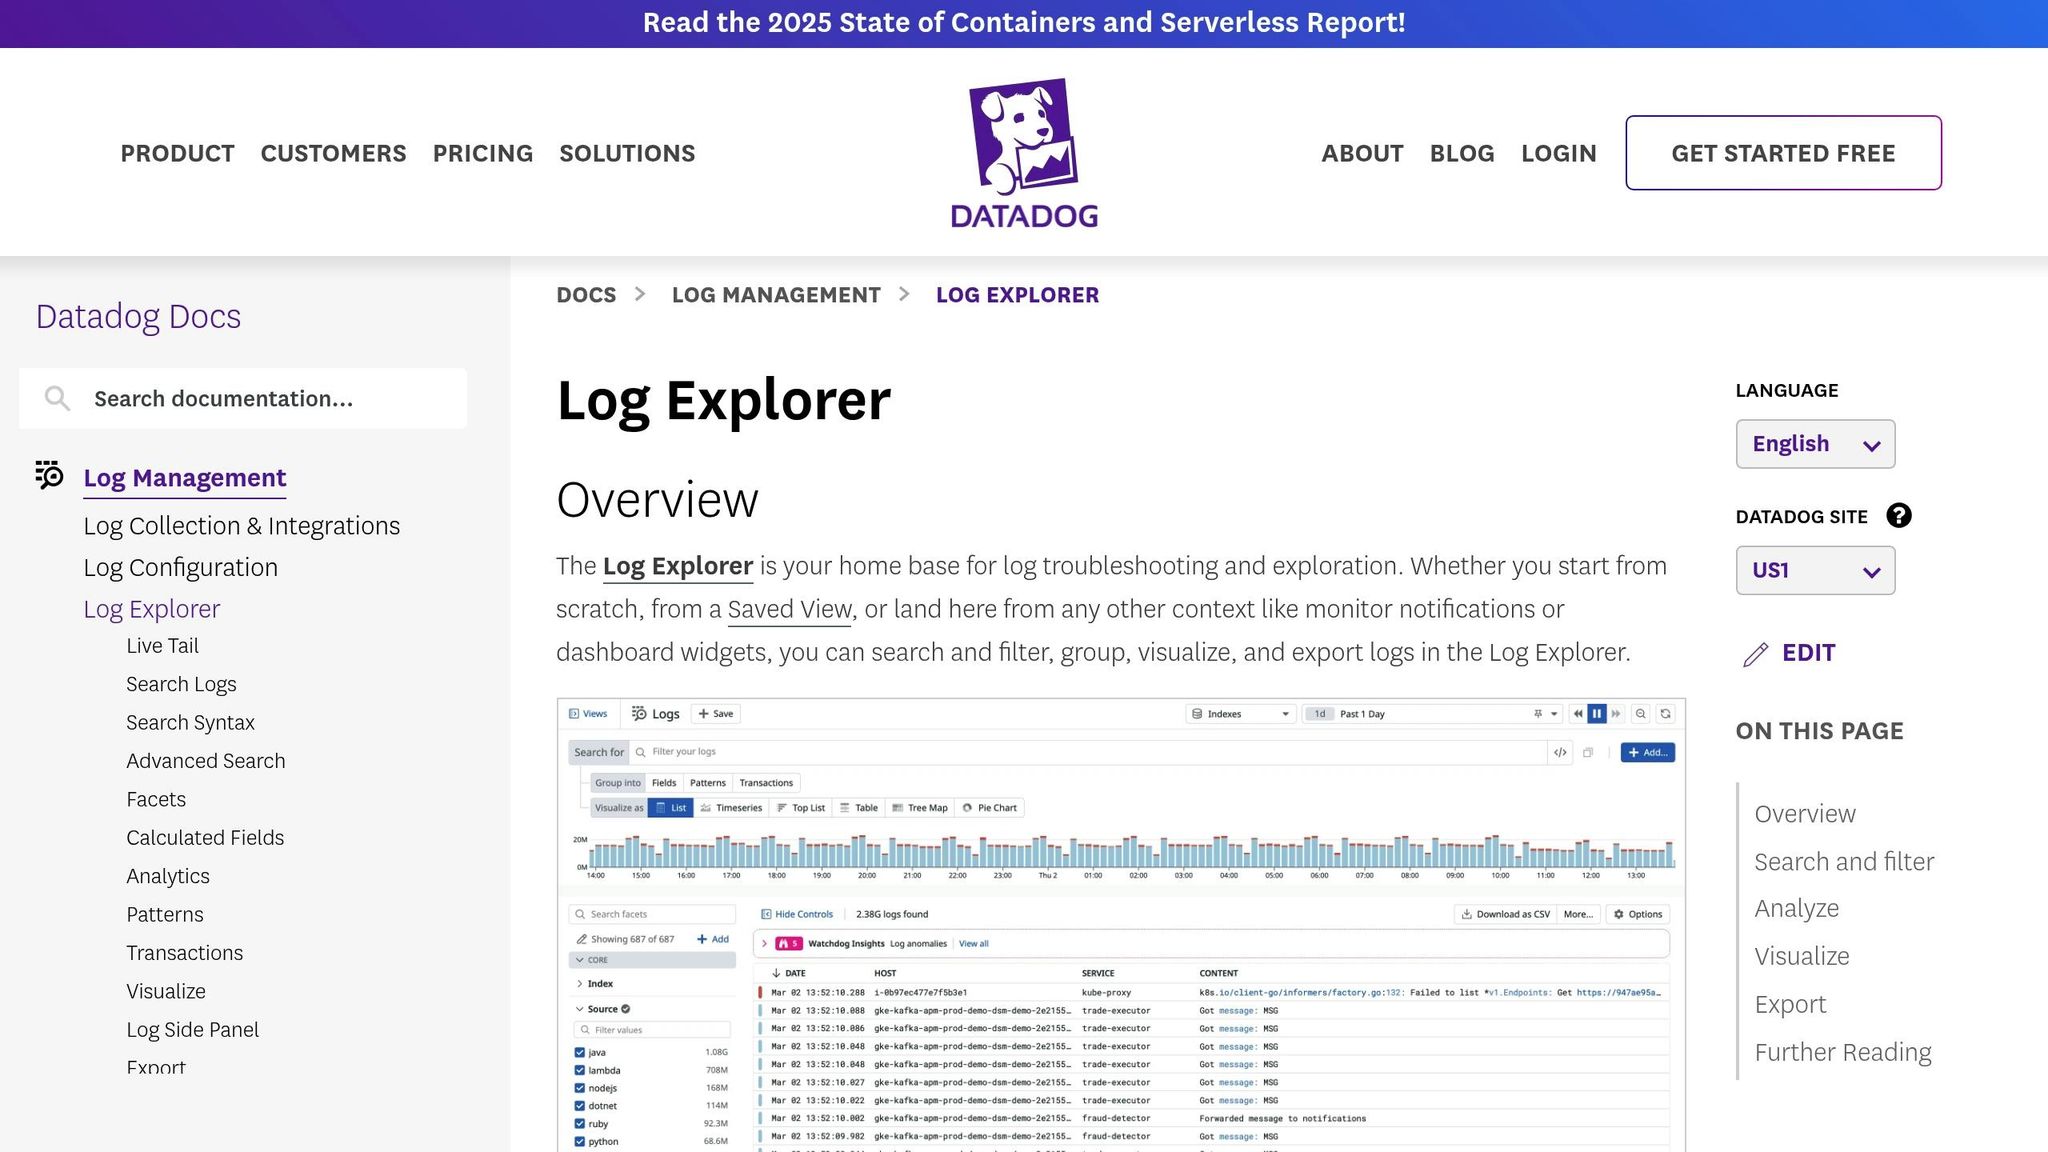
The Log Explorer is your go-to tool for checking if your parsing fixes are working as expected. Start by filtering logs in the search bar - use criteria like service, source, or host to narrow down to the logs impacted by your changes. Click on any log entry to see both the raw and parsed data side by side.
Look for your custom fields in the parsed data - they should show up as distinct keys with accurate values. If they don’t, it’s time to tweak your grok pattern. You can also search for specific error flags like datadog.error.type:grok_parse_failure or status:error to identify logs that weren’t parsed correctly. A successful fix will remove these errors.
For real-time validation, use the Live Tail feature. This lets you monitor logs as they come in, so you can immediately see if your pipeline changes are working. Additionally, check the facet list on the left side of the Log Explorer. Newly extracted fields should appear here, confirming they’re searchable and ready for use in dashboards or monitors. To ensure everything works smoothly, test your parsing rules on sample logs before applying them broadly.
Test Parsing Rules with Sample Logs
The Grok Parser's testing tool within the Pipeline configuration is perfect for fine-tuning your parsing rules. Simply paste a sample log into the "Sample Log" field to get an instant preview of how your grok pattern extracts data. The Parsed Result pane will show you the resulting JSON structure, making it easy to spot any errors or incomplete extractions.
Don’t stop at just one sample - test your grok patterns with a variety of logs, including edge cases with optional fields or unusual formats. The tool’s interface highlights mismatches, helping you quickly identify and fix issues. This step ensures your parsing rules are robust and prevents errors from affecting your live log stream.
How to Monitor Log Ingestion After Fixes
Track Log Intake Metrics
Once you've applied fixes, the next step is to ensure that logs are flowing correctly. Start by keeping an eye on key metrics like datadog.estimated_usage.logs.ingested_events and datadog.estimated_usage.logs.ingested_bytes. These metrics help confirm whether your parsing corrections are working as intended and that your earlier configuration and grok fixes are effective.
To make things easier to track, consolidate these metrics into a dashboard. Display raw ingestion rates alongside parsed log counts using Logs to Metrics. This setup allows you to track trends over time without the need to store full logs for extended periods. Instead, you can store aggregated log data as metrics for up to 15 months, which is more cost-effective than retaining full logs. This approach ensures you can validate that logs are being ingested and parsed correctly.
Set up a log monitor to flag unusual error tags (like status:error) to catch any lingering parsing issues. Head over to the Pipelines page and check the Pipeline Monitoring tab to see if any processors are causing bottlenecks or experiencing high failure rates.
For a quick validation, graph parsing error volumes in the Log Explorer's Analytics view. A successful fix will show these errors trending toward zero. Use the "Group by" function to verify that new logs are populating the corrected fields as expected.
To avoid future problems, create metric-based ingestion alerts using datadog.estimated_usage.logs.ingested_events. These alerts can help you spot sudden spikes or drops in log volume. Break down the metrics by service, data type, or host to pinpoint problematic sources and address new issues before they disrupt log analysis.
Conclusion
Following the troubleshooting and testing steps outlined earlier is key to keeping your log pipelines dependable and efficient.
To fix log parsing errors, start by querying unparsed logs (datadog.pipelines:false), double-check your log source configurations and permissions, debug Grok patterns step by step, and thoroughly test before deploying changes. These efforts help convert raw logs into structured data, enabling dashboards, alerts, and root cause analysis to function effectively.
Keep in mind that maintaining reliable pipelines requires constant vigilance. As applications evolve, parsing rules can break without warning, and changes in log formats can silently disrupt parsing. Regular monitoring is essential to catch these issues early and prevent gaps in your observability tools.
"Logs are only as useful as their structure. Revisit and iterate on your pipelines regularly, version control them like any other code, and stay vigilant for unparsed or underutilized data." – Dataiker
Treat your parsing rules with the same care as production code. Store them in version control, test them against a variety of log samples (aim for 10–20 variations), and monitor error metrics like status:error or datadog.error.type:grok_parser to identify and address problems quickly.
Structured logs are the backbone of precise alerting and effective correlation. As discussed earlier, keeping pipelines streamlined, rigorously testing patterns, and maintaining continuous monitoring ensures your observability remains intact. By consistently applying these practices, you can sustain clear visibility and enable faster issue resolution across your monitoring setup.
FAQs
How do I detect and fix silent log parsing issues in Datadog?
To spot silent log parsing issues in Datadog, start by looking for logs that aren't being parsed correctly. These are logs that fail to match your defined parsing patterns - like grok patterns - and might be missing essential fields. One way to catch these is by setting up queries or alerts to flag logs that remain unparsed or incomplete.
When you encounter problems, take a closer look at your parsing rules and configuration settings. Ensure they match the actual format of the logs being ingested. Misconfigured patterns or missing fields are common culprits. By regularly reviewing your log collection setup, you can catch these issues early and maintain accurate log analysis.
Why are timestamps in my Datadog logs being recognized incorrectly?
Timestamp issues in Datadog logs usually stem from problems with the way logs are formatted or parsed. A major culprit is the use of non-standard or custom time formats that Datadog’s parser can’t automatically interpret. For instance, formats that stray from widely accepted standards like ISO 8601 or RFC 3339 often cause trouble.
Another common issue arises when logs lack explicit timezone information. If your logs rely on local time without including clear timezone offsets, Datadog assumes the timestamps are in UTC. This can lead to incorrect time interpretation, especially when logs originate from multiple time zones.
How to Fix Timestamp Issues
To avoid these problems, follow these steps:
- Stick to standard formats: Use timestamp formats like ISO 8601 or RFC 3339 whenever possible.
- Include timezone data: Always specify a timezone or offset to ensure accurate interpretation.
- Handle custom formats carefully: If you must use a custom timestamp format, configure parsing rules that align with your log structure.
- Simplify your formats: Avoid overly complicated or inconsistent timestamp formats to reduce parsing errors.
By sticking to these guidelines, you can ensure your logs are parsed accurately and avoid unnecessary headaches.
How can I effectively test Grok patterns in Datadog?
To test Grok patterns effectively in Datadog, use the Grok Parser Processor to validate them against sample logs. This tool ensures your patterns extract the right fields and function as intended.
Begin with straightforward patterns and test them using real log samples. Adjust and refine as needed. Frequent testing and iteration help identify issues early and improve precision. Aim to create patterns that are both easy to understand and efficient.
This method allows you to troubleshoot and fine-tune your Grok patterns for dependable log parsing in Datadog.