How To Monitor MySQL With Datadog
Guide to monitor MySQL with Datadog: create a monitoring user, enable Performance Schema, install the Agent, collect logs, configure alerts and build dashboards.
Monitoring MySQL with Datadog helps you track database performance, identify bottlenecks, and troubleshoot issues efficiently. Here's a quick guide to get started:
- Why Monitor MySQL?: Detect slowdowns, prevent connection limits, and optimize resource usage like CPU, memory, and I/O.
- What Datadog Offers: Over 60 MySQL metrics, query-level insights, anomaly detection, and integrated log management.
- Setup Requirements:
- Datadog account and API key.
- Datadog Agent installed on your server.
- MySQL Performance Schema enabled.
- Administrative access to create a monitoring user.
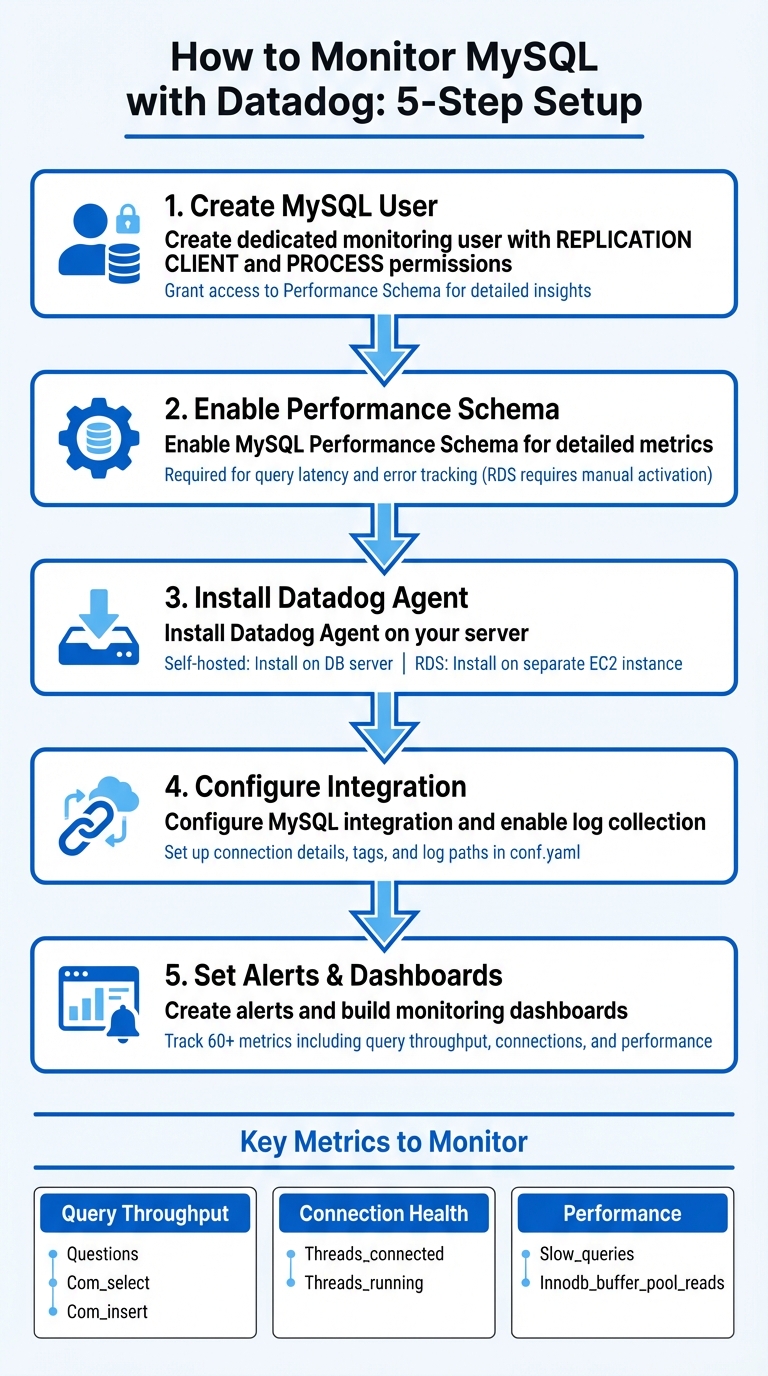
- Steps:
- Create a dedicated MySQL user with permissions for monitoring.
- Enable the MySQL Performance Schema for detailed metrics.
- Install and configure the Datadog Agent to collect metrics and logs.
- Set up alerts for issues like high connection usage or slow queries.
- Build dashboards to monitor query throughput, resource usage, and connection health.
Key Metrics to Watch:
- Query throughput:
Questions,Com_select,Com_insert. - Connection health:
Threads_connected,Threads_running. - Performance:
Slow_queries,Innodb_buffer_pool_reads.
Best Practices:
- Optimize slow queries by adjusting
long_query_time. - Scale monitoring with automated configurations and tags.
- Secure credentials with tools like AWS Secrets Manager.
Datadog's tools simplify MySQL monitoring, providing actionable insights to maintain database health and improve performance as your system grows. For smaller organizations, scaling with Datadog for SMBs ensures you maximize these insights while managing costs effectively.
5-Step Process to Monitor MySQL with Datadog
Preparing MySQL for Datadog Integration
Creating a Datadog User in MySQL
To securely monitor MySQL with Datadog, start by creating a dedicated user with the necessary permissions. This ensures the Agent can collect metrics and analyze performance data without compromising security.
Log into MySQL and execute the following command to create the user:
CREATE USER 'datadog'@'localhost' IDENTIFIED BY '<PASSWORD>';
Next, grant the required permissions to enable metric collection:
GRANT REPLICATION CLIENT ON *.* TO 'datadog'@'localhost';
GRANT PROCESS ON *.* TO 'datadog'@'localhost';
REPLICATION CLIENT: Allows the Agent to check replication status and basic server metrics.PROCESS: Lets the Agent view active threads and their queries.
For more detailed performance insights, grant access to the Performance Schema:
GRANT SELECT ON performance_schema.* TO 'datadog'@'localhost';
If you're monitoring an Amazon RDS instance, the Datadog Agent should be run on a separate EC2 instance within the same security group. In this case, replace localhost with the RDS instance endpoint.
Finally, enable the Performance Schema to collect detailed metrics.
Enabling MySQL Performance Schema
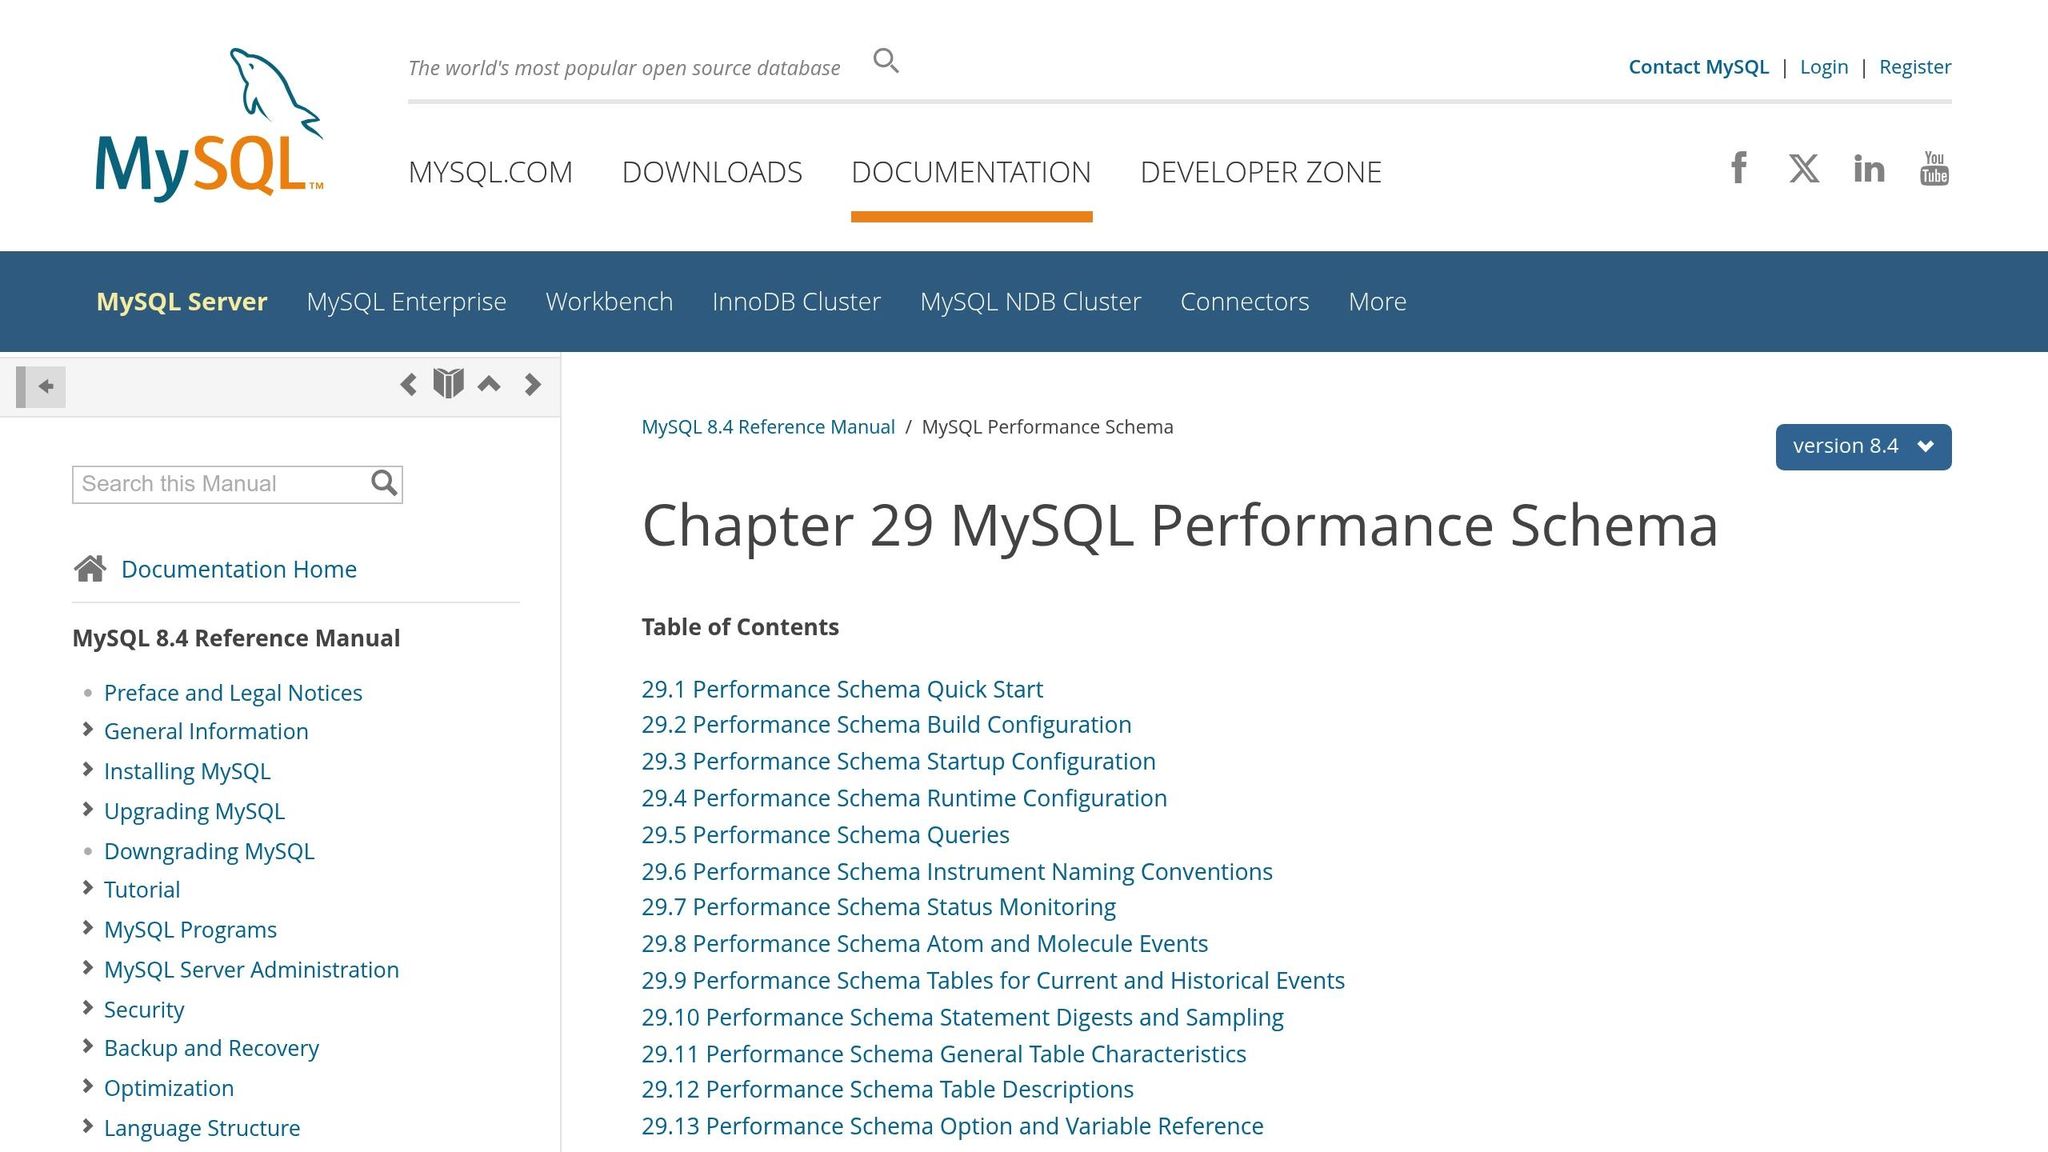
In MySQL versions 5.6.6 and later, the Performance Schema is enabled by default. However, if you're using Amazon RDS, you'll need to activate it manually. Without this, you won't have access to critical data like query latency or error tracking.
For Amazon RDS, follow these steps:
- Go to the AWS Management Console.
- Locate the parameter group for your database instance.
- Set the
performance_schemaparameter to1.
Keep in mind that this change requires a database reboot to take effect. After the reboot, confirm the schema is active by running:
SHOW VARIABLES LIKE 'performance_schema';
If you're using MySQL 5.6 and don't have the sys schema (which simplifies Performance Schema data), you'll need to install it manually. Starting with MySQL 5.7.7, the sys schema is included by default. For older versions, clone the mysql-sys repository from GitHub, generate an RDS-compatible SQL file, and load it into your database.
Once enabled, the Performance Schema provides detailed statistics on query latency, errors, and throughput. These metrics are stored in tables like performance_schema.events_statements_summary_by_digest, with timing data recorded in picoseconds for precision. This level of detail is essential for effective performance monitoring.
Installing and Setting Up the Datadog Agent
Installing the Datadog Agent
Once your MySQL setup is ready, the next step is installing the Datadog Agent to start collecting metrics. The Agent works across various operating systems, including Linux, Windows, MacOS, and AIX. For self-hosted MySQL, the Agent should be installed directly on your database server. If you're using Amazon RDS or other managed MySQL services, install the Agent on a separate EC2 instance within the same security group, as direct access to the RDS host isn't possible.
To install, use the single-command script provided in your Datadog account. This command will immediately start the Agent and begin collecting basic system metrics. The main configuration file for the Agent is located at /etc/datadog-agent/datadog.yaml on Linux systems, where your API key will already be set up.
Configuring the MySQL Integration
To integrate MySQL, open the configuration file found at /etc/datadog-agent/conf.d/mysql.d/conf.yaml. In this file, you'll input your MySQL connection details, using the Datadog user and the Performance Schema settings you set up earlier. For RDS instances, use the full endpoint (e.g., instance_name.xxxx.us-east-1.rds.amazonaws.com) instead of localhost. Include the Datadog user's credentials and the port number (commonly 3306).
It's a good idea to tag your metrics with identifiers like dbinstanceidentifier:instance_name to differentiate database metrics from host-level ones. Adding tags such as env:production can also help you organize and filter data in Datadog.
Setting Up Log Collection
To enable MySQL log collection, start by setting logs_enabled: true in the /etc/datadog-agent/datadog.yaml file. Then, configure MySQL logging in your my.cnf file. Activate options like general_log, log_error, and slow_query_log, and specify the file paths where these logs should be stored.
In the mysql.d/conf.yaml file, add a logs section to define the paths for each log type. For slow query logs, you can use log_processing_rules with a multi_line pattern, such as "# Time:", to make sure each slow query is treated as a single log entry rather than split into multiple lines.
For RDS users, since the Agent can't directly access log files, you'll need to send RDS logs to CloudWatch Logs first. From there, use Datadog's Lambda function to forward the logs to Datadog.
After making these changes, restart the Agent and confirm everything is running smoothly by using the datadog-agent status command.
Session 9 | Datadog Advance | Datadog Integration with MySql
Tracking Key Metrics and Improving Performance
With MySQL integrated into your system, it's crucial to keep an eye on essential performance metrics to quickly identify and address any issues that may arise.
Important Metrics to Track
Datadog's MySQL integration collects over 60 metrics. Among these, query throughput is a key indicator of database health. Pay attention to the Questions metric, which tracks the total number of statements sent by clients. Break this down into reads (Com_select) and writes (Com_insert, Com_update, Com_delete) to understand your workload better. A sudden drop in throughput could signal connectivity issues or application-level problems.
Connection health is another critical area. Use Threads_connected and Threads_running to monitor active connections. With the default MySQL connection limit typically set at 151, hitting this cap means new clients might encounter "Too many connections" errors. For query performance, track Slow_queries - queries exceeding the long_query_time threshold (default: 10 seconds) - and monitor average query run times. Increased latency often suggests resource limitations, lock contention, or inefficient query patterns.
The InnoDB buffer pool plays a vital role in caching table and index data in memory. Keep an eye on Innodb_buffer_pool_reads for spikes, as these may indicate insufficient memory caching, which increases reliance on slower disk I/O. While the default buffer pool size is 128 MiB, dedicated database servers can often allocate up to 80% of physical memory for this purpose. For distributed systems, monitor ReplicaLag to ensure replicas aren't falling too far behind the primary node. Persistent lag may point to resource or network bottlenecks.
Creating Alerts for Critical Issues
Automated alerts can help you catch database problems before they escalate. For example, configure alerts on Threads_connected to ensure it stays below your max_connections limit. Also, monitor Aborted_connects to identify when clients fail to connect, and track Connection_errors_internal to catch server-side issues like out-of-memory conditions.
For query performance, consider lowering the long_query_time parameter to something more relevant to your application, such as 5 seconds. Set alerts for increases in Slow_queries and monitor average query run times for trends that could indicate bottlenecks. If you notice higher Innodb_buffer_pool_reads, it may be time to increase the buffer pool size to maintain optimal performance. These alerts can be integrated into real-time dashboards for continuous monitoring.
Building Dashboards for Real-Time Monitoring
Datadog provides pre-built dashboards like "MySQL - Overview" and "Amazon - RDS (MySQL)" that automatically populate with key metrics once the integration is set up. You can clone and customize these dashboards to fit your specific requirements. Use variables like $dbinstanceidentifier for easy filtering.
A well-designed dashboard should provide a comprehensive view of your system, including query volume (queries per second, slow queries, reads/writes per second), disk I/O (total IOPS, disk queue depth, and read/write latency), connections (threads connected, threads running, and connection errors), and resource usage (CPU utilization, free memory, and swap usage). If you're using RDS, enable Enhanced Monitoring to access high-resolution metrics - updating as frequently as once per second and offering over 50 system-level metrics. Consistent tagging, such as dbinstanceidentifier, helps unify metrics from different sources and allows you to correlate database performance with other parts of your infrastructure.
MySQL Monitoring Best Practices for SMBs
Once you've set up MySQL monitoring, a few essential practices can help you get the most out of your setup while keeping team effort and costs in check.
Improving Query Performance
Datadog Database Monitoring offers a clear view of normalized statements in performance_schema.events_statements_summary_by_digest, allowing you to track key metrics like latency, errors, and query volume. Additionally, the MySQL sys schema is a handy tool for identifying the slowest queries or those with the highest error rates.
To better capture slow queries, adjust the long_query_time parameter to around 5 seconds using SET GLOBAL long_query_time = N;. When query performance drops, examine system resources such as CPU usage, I/O bottlenecks, or high disk queue depth to identify root causes. Keep an eye on Innodb_row_lock_waits to detect frequent row-level lock waits, which can significantly impact performance. If your buffer pool is in the multi-gigabyte range, consider splitting it into multiple innodb_buffer_pool_instances to improve concurrency and reduce contention.
Once your queries are optimized, you can expand your monitoring setup to cover all database instances effectively.
Scaling Your Monitoring Setup
After addressing query performance, it's time to ensure your monitoring scales as your infrastructure grows. As your database environment expands, manually configuring monitoring for each instance can become impractical. Use environment tags like env:prod or env:staging and leverage Datadog's Remote Agent Management to automate configurations across multiple instances. In containerized or Kubernetes setups, enable Autodiscovery to automatically detect and monitor new MySQL instances as they're deployed.
To avoid overloading your system, adjust data collection frequency based on system load. For high-traffic environments, enable RDS Enhanced Monitoring to capture over 50 system-level metrics, with updates as frequent as once per second. As your infrastructure evolves, review and update alert thresholds quarterly to prevent unnecessary alerts from outdated baselines.
Maintaining Security and Compliance
Security is just as important as performance when it comes to monitoring. Limit MySQL access to authorized hosts through private endpoints and strict firewall rules. If you're using AWS RDS, deploy the Datadog Agent on an EC2 instance within the same security group as your MySQL instance to reduce exposure.
Use Datadog's Secrets Management to store database credentials securely, avoiding plaintext passwords in configuration files. For AWS RDS integrations, implement IAM role delegation with read-only policies to ensure Datadog only accesses the metrics it needs. Automate credential rotation using tools like AWS Secrets Manager or Vault to regularly renew the credentials used by the Datadog Agent. For businesses in regulated industries, configure the Datadog Agent to meet FIPS compliance standards. Lastly, use the Sensitive Data Scanner to identify and mask PII or other sensitive information in database logs before they're sent to Datadog.
Conclusion
Key Takeaways
Monitoring MySQL with Datadog brings together metrics, traces, and logs from across your infrastructure, giving you a consolidated view of your database's performance and health. Throughout this process, you set up a dedicated MySQL user, enabled the Performance Schema, installed the Datadog Agent, and configured log collection. With these steps, you gained the tools to track essential metrics, create automated alerts, and design dashboards for real-time insights into your database's status.
Datadog covers a wide range of metrics, including detailed InnoDB-specific data. If you're using AWS RDS, Enhanced Monitoring provides high-frequency system metrics to further enhance visibility. Additionally, Datadog's Watchdog feature leverages machine learning to detect anomalies, such as unexpected error spikes or latency issues, without requiring manual setup.
"Monitoring MySQL with Datadog provides critical visibility into what's happening with your database and the applications that depend on it." - Datadog
By applying the best practices discussed - like optimizing query performance and scaling your monitoring setup - you’re equipped to maintain smooth MySQL operations as your business grows. These tools and insights build upon earlier configuration steps, ensuring a comprehensive approach to database monitoring. With this unified perspective, you can confidently take the next steps to refine and enhance your MySQL performance.
Next Steps
Activate Database Monitoring (DBM) to identify inefficient queries based on execution time, frequency, or returned rows. Utilize Datadog's pre-built dashboards, such as "MySQL - Overview" or "Amazon - RDS (MySQL)", to quickly visualize critical metrics like query throughput and buffer pool usage. Additionally, enable log collection for error, general, and slow query logs, and use the Log Explorer's "Log Patterns" feature to detect unusual behaviors.
As you gain experience, dive into Application Performance Monitoring (APM) to trace requests from your application layer to the database. This feature lets you analyze latency and errors in context using flame graphs. The Datadog Agent also supports metrics collection from over 1,000 other applications and services, allowing you to correlate database performance with the overall health of your infrastructure. For more practical tips and guidance, check out the Scaling with Datadog for SMBs blog (https://datadog.criticalcloud.ai), which is tailored to help small and medium-sized businesses maximize their Datadog setup.
FAQs
What’s the minimum MySQL permission set Datadog needs?
Datadog needs at least read-only permissions for MySQL to function correctly. This includes access to query performance schema and metrics. To enhance security, it's a good idea to set up role-based access specifically limited to metrics queries. Additionally, managing credentials securely through a secrets manager is highly recommended. For added protection, make sure to rotate credentials regularly to minimize potential risks.
How do I monitor AWS RDS MySQL if I can’t install the Agent on RDS?
To keep an eye on AWS RDS MySQL without needing to install an Agent, you can rely on Amazon CloudWatch metrics and enhanced RDS monitoring. Start by enabling enhanced monitoring in the RDS console. This feature gathers detailed, high-resolution metrics and sends them directly to CloudWatch Logs.
From there, Datadog can seamlessly integrate with these logs and metrics. This setup allows you to track essential performance metrics - like CPU usage, memory consumption, and disk I/O - using either pre-built dashboards or custom ones tailored to your needs.
Which three MySQL metrics should I alert on first?
When it comes to maintaining a healthy MySQL database, there are three key metrics that deserve your attention:
- Query Volume Metrics (Queries per Second): This metric gives you a snapshot of how much work your database is handling. By keeping tabs on queries per second, you can monitor the database load and ensure queries are performing as expected.
- Connection Metrics (Connections): Tracking active connections is crucial for spotting potential overloads. If too many connections are active at once, it could signal that your database is under strain.
- Disk I/O Metrics: Keeping an eye on read and write operations helps you identify performance bottlenecks. Disk I/O issues can slow down your database significantly, so early detection is key.
Paying attention to these metrics helps you stay ahead of potential problems and maintain smooth database operations.