
How to Set Up Datadog Monitoring on Render Using Docker or API Integration
Learn how to effectively set up Datadog monitoring for your Render applications using Docker or API integration for enhanced performance insights.
Want to monitor your Render apps with Datadog? Here's how you can do it using Docker or API integration.
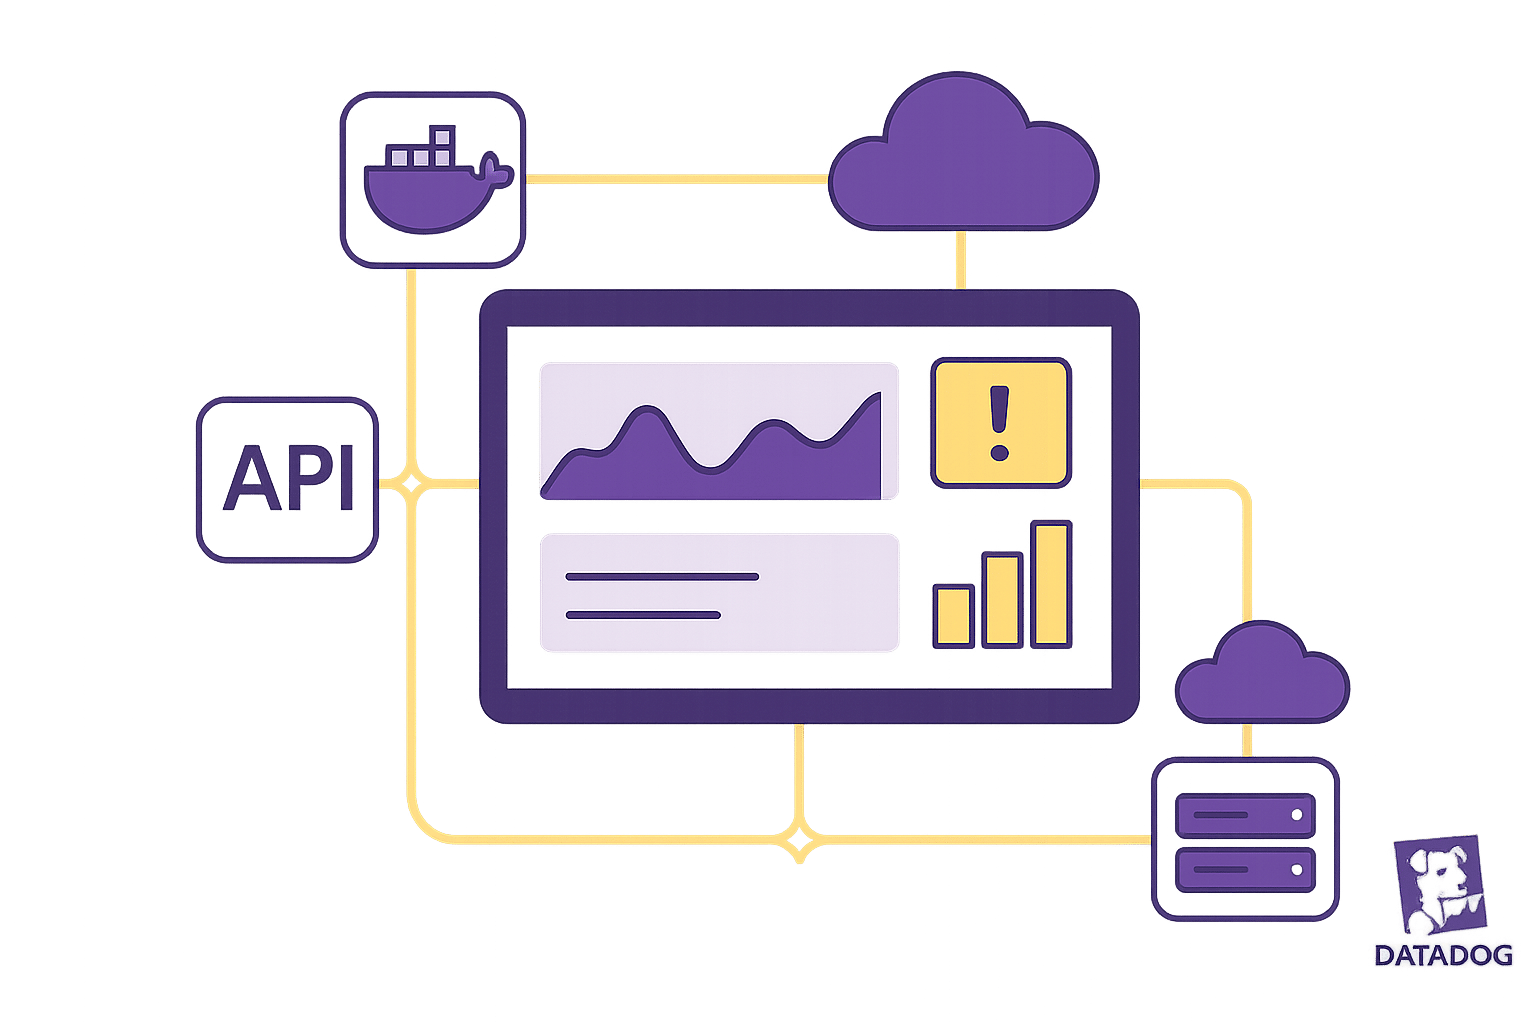
Datadog makes it easy to track the performance of your Render-hosted applications. Whether you prefer Docker or API integration, this guide covers everything you need to set up monitoring effectively.
Key Steps:
- For Docker Users: Create a Datadog Agent
Dockerfile, configuredocker-compose.yaml, and enable log forwarding for real-time monitoring. - For API Integration: Use a Datadog organization-level API key to collect metrics, monitor databases, and set up alerts.
Benefits of Datadog + Render:
- Detailed Metrics: Go beyond Render's dashboard to monitor database performance, system usage, and logs.
- Real-Time Alerts: Get notified about issues like memory leaks or high error rates.
- Centralized Dashboards: View all your app's performance data in one place.
Quick Setup Checklist:
- Accounts: Ensure you have active Datadog and Render accounts.
- Environment Variables: Configure
DD_API_KEY,DD_SITE, andDD_ENVfor secure integration. - Log Forwarding: Use Datadog's TCP log forwarding endpoints (e.g.,
intake.logs.datadoghq.com:10516for US1).
By following this guide, you'll gain better insights into your app's performance, improve issue resolution, and manage costs effectively.
Before You Begin: Setup Requirements
Required Accounts and Access
To get started, make sure you have the following:
- An active Datadog account with organization-level access.
- A Render account where your apps are hosted.
For authentication, you'll specifically need a Datadog organization API key (note: this is not the same as an application key or user-scoped API key). Additionally, ensure you have administrative access to your Render Dashboard. If you're planning to monitor Postgres, configure your API key directly in the Render Dashboard.
Setting Up Environment Variables
Environment variables play a crucial role in securing your integration. Here are the key variables you need to configure:
| Variable Name | Purpose |
|---|---|
DD_API_KEY |
Used for authenticating with Datadog. |
DD_SITE |
Specifies the Datadog site (e.g., US1). |
DD_ENV |
Defines the environment name. |
You can set up these variables through the Render Dashboard, .env files, or Blueprints. Once your credentials are securely in place, you're ready to dive into Docker and API requirements.
Docker and API Basics
Before proceeding, it's important to have a good understanding of some Docker and API essentials:
-
For Docker:
- Familiarity with basic Docker commands.
- Knowledge of Docker Compose for managing multi-container applications.
- Experience configuring container images using Dockerfiles.
-
For API Integration:
- Best practices for managing and securing API keys.
- Setting up metric collection endpoints.
- Configuring and maintaining service monitors.
Understanding these foundational concepts will make the integration process much smoother. Additionally, the integration supports TCP log forwarding with TLS encryption for enhanced security.
Method 1: Docker Integration Steps
Setting Up the Datadog Agent Dockerfile
The Datadog Agent Dockerfile is a key component for monitoring your Render apps. To get started, create a new Dockerfile in your project's root directory. Below is a basic setup that you can tweak depending on your specific monitoring needs:
FROM datadog/docker-dd-agent:latest-alpine

# Add custom configurations if needed
COPY conf.d/ /etc/dd-agent/conf.d/

# Set environment variables
ENV DD_APM_ENABLED=true
ENV DD_LOGS_ENABLED=true
ENV DD_PROCESS_AGENT_ENABLED=true
This configuration uses an Alpine-based image, which is recommended for its smaller size and efficient performance while still offering full functionality.
Docker Compose Configuration
Next, update or create a docker-compose.yaml file to integrate the Datadog Agent service with your existing setup. Here's an example configuration:
version: '3'
services:
  datadog-agent:
    build:
      context: .
      dockerfile: Dockerfile
    environment:
      - DD_API_KEY=${DD_API_KEY}
      - DD_SITE=US1
      - DD_ENV=production
    volumes:
      - /var/run/docker.sock:/var/run/docker.sock:ro
      - /proc/:/host/proc/:ro
      - /sys/fs/cgroup:/host/sys/fs/cgroup:ro
    restart: always
To add custom checks, mount the necessary directories:
| Directory | Purpose |
|---|---|
/checks.d/ |
Custom check scripts |
/conf.d/ |
Configuration files |
Testing Docker Integration
Once your containers are deployed, verify the Datadog Agent is running. Check your Datadog dashboard to confirm that metrics are being collected. Key areas to monitor include:
- Container metrics
- Application traces
- Custom metrics (if configured)
For log monitoring, use TCP log forwarding with TLS encryption. Be sure to configure your log endpoints based on your Datadog site:
| Datadog Site | Log Endpoint |
|---|---|
| US1 | intake.logs.datadoghq.com:10516 |
| EU | tcp-intake.logs.datadoghq.eu:443 |
"Datadog helps you capture application traces and metrics that can help you improve the performance for your app."
If data isn’t appearing as expected, check your container logs and make sure your API key is correctly set in the environment variables. The Datadog Agent offers a high level of flexibility, allowing you to modify collection parameters through environment variables to suit your specific monitoring goals.
With Docker integration up and running, you’re ready to explore API integration for even more customization.
Method 2: API Integration Steps
Setting Up API Keys
To kick off your API integration, you'll need an organization-level API key. Head to your Datadog organization settings page and create a new API key.
"Make sure to create an API key for your organization. The Datadog integration doesn't support using an application key or a user-scoped API key." - Render Docs
Once you've got your API key, you're ready to move on to configuring metric collection.
Configuring Metric Collection
Now that you have your API key, it's time to set up metric collection for your Render services. Here's how to handle databases specifically:
-
For New Databases
When creating a new database via the Render Dashboard, input your Datadog API key during the setup process. -
For Existing Databases
Add your API key through the database settings in the Render Dashboard. Keep in mind, this step will require restarting the database.
Additionally, ensure that you forward logs to the appropriate endpoint for your Datadog site, as outlined in earlier steps.
Once metrics are being collected, the next step is to create service monitors to keep an eye on key performance indicators.
Creating Service Monitors
With your environment variables configured, you can set up service monitors to automate alerting. For instance, AcmeCorp integrated Datadog with their Render Postgres and discovered a memory leak during a 2-minute restart downtime.
To get started with service monitors:
- Configure the necessary environment variables in the Render Dashboard.
- Add your Datadog API key and site information.
- Enable TCP log forwarding to ensure logs are properly sent.
- Use the Datadog dashboard to verify that data is flowing correctly.
For Postgres databases, make sure to configure the API key in the database settings. This enables both metric collection and automated alerts based on performance metrics, helping you stay ahead of potential issues.
Testing and Fixing Integration Issues
Checking Data Flow
To confirm that your Datadog integration is functioning correctly, head over to the Datadog dashboard or metrics explorer. Use the database-id tag to filter metrics and ensure it matches your Render Postgres ID.
For log streams, double-check the endpoint configuration based on your Datadog site. Here's a quick reference for the log forwarding endpoints:
| Datadog Site | Log Forwarding Endpoint |
|---|---|
| US1 | intake.logs.datadoghq.com:10516 |
| EU | tcp-intake.logs.datadoghq.eu:443 |
This initial check ensures the setup is on track before moving on to troubleshoot common issues.
Fixing Common Problems
When setting up Datadog with Render, you might encounter a few common hiccups. Here’s how to address them:
Site Compatibility
If you’re having trouble connecting, make sure you’re using either the US1 or EU Datadog site. Other sites like EU1, US3, or US5 are not supported for this integration.
API Key Configuration
If you’ve added or updated a Datadog API key for your Postgres database, don’t forget to restart the database afterward. Also, ensure you’re using an organization-level API key. The integration doesn’t work with application keys or user-scoped API keys.
Log Forwarding
If logs aren’t showing up in Datadog, review the TCP log forwarding settings. Confirm the following:
- TCP log forwarding is enabled for your Datadog site.
- The endpoint matches your region.
- TLS is configured correctly for secure log transmission.
If these steps don’t resolve the issue, you can dig deeper using Render Debug Tools.
Using Render Debug Tools
Render Debug Tools can help you pinpoint problems and validate your setup. Here’s how to use them effectively:
-
Validate the API Key
Use Datadog’s validate endpoint to check for authentication issues right away. -
Verify TCP Connection
Ensure that your service can establish a TCP connection to the correct Datadog endpoint. -
Check TLS Configuration
Confirm that TLS is enabled and functioning properly for secure log forwarding. -
Monitor Log Flow
Use Render’s logging tools to confirm that logs are being generated and forwarded as expected.
These steps will help you troubleshoot and resolve most integration challenges efficiently.
Managing Datadog Costs for SMBs
Reducing Data Collection Costs
Keeping your Datadog costs under control starts with optimizing how you collect and store data. Here's a breakdown of Datadog's core services and some tips to manage expenses:
| Service Type | Cost | Best Practice |
|---|---|---|
| Infrastructure Monitoring | $15/host/month | Filter by database-id tag |
| Log Management | $0.10/GB ingested | Use retention filters |
| APM | $31/host/month | Implement sampling |
| RUM | $1.50/1,000 sessions | Focus on production traffic |
To cut costs without sacrificing monitoring quality, consider these strategies:
- Log Sampling: For services with high log volumes, keep only a representative sample. This approach reduces storage costs while retaining the insights needed to monitor system behavior effectively.
- Custom Metrics Optimization: Limit metric cardinality by tagging only critical dimensions. For instance, tag production databases but exclude development environments.
- Shorten Log Retention: Adjusting log retention from 15 days to 3 days can reduce costs by 37%. For older logs, move them to more affordable storage options like Amazon S3.
By combining efficient data collection practices with meaningful alerting, you can strike a balance between cost and performance.
Building Useful Alerts
Alerts are essential for maintaining performance, but too many can lead to alert fatigue. Focus on creating alerts that provide actionable insights. Key metrics to monitor include:
- Resource Utilization: Keep an eye on CPU, memory, and disk usage to prevent bottlenecks.
- Database Performance: Monitor query response times and connection pool usage.
- Error Rates: Track application errors and failed requests to address issues promptly.
- Response Times: Measure API endpoint performance to ensure a smooth user experience.
Set thresholds based on your application's usual behavior, and use Datadog's anomaly detection to identify patterns that deviate from the norm. This approach minimizes unnecessary noise and ensures your team can focus on critical issues.
Planning for Growth
As your application scales on Render, your monitoring requirements will naturally increase. To manage costs as you grow, consider these strategies:
- Pre-aggregate Metrics: Combine node-level data before sending it to Datadog. This reduces data volume while maintaining visibility.
- Automate Monitoring Schedules: Turn off non-production monitoring during off-hours to save on costs.
- Take Advantage of Committed Use Discounts: For predictable usage, committed pricing can help you secure significant savings.
Regularly review your Datadog setup to ensure it aligns with your current needs. Remove unused metrics, consolidate redundant ones, and adjust data collection frequencies to keep your monitoring expenses in check as your application scales.
How to Reduce Your Datadog Costs by Optimizing Metric Cardinality
Conclusion: Next Steps
Building on your Docker or API integration, these steps focus on transforming raw data into actionable insights for better system performance.
Start with Core Metrics
Here’s a quick overview of the key metrics to monitor:
| Metric Type | Key Indicators | Why It Matters |
|---|---|---|
| System | CPU usage, memory usage | Helps fine-tune resources |
| Database | Query response times, connection pools | Tracks database efficiency |
| Application | Error rates, response times | Enhances user experience |
By keeping an eye on these metrics, you can ensure your setup meets the necessary performance benchmarks.
Broaden Your Monitoring Approach
-
Dive Deeper into Database Performance
- Revisit your Postgres monitoring setup.
- Keep tabs on query performance, connections, and I/O activity.
-
Simplify Log Management
- Set up TCP log forwarding with TLS to send logs securely to Datadog US1.
- Combine logs into unified views for quicker problem resolution.
-
Refine Dashboard Layouts
- Build dashboards that integrate application and database metrics.
- Highlight areas like resource usage and performance bottlenecks for better insights.
Regularly assessing these metrics will help you fine-tune your monitoring strategy, balance costs, and maintain comprehensive oversight of critical system performance indicators.
FAQs
What are the benefits of using Docker integration instead of API integration for setting up Datadog monitoring on Render?
Using Docker integration for Datadog monitoring on Render brings several clear benefits when compared to API integration:
- Ease of Setup: With Docker integration, the Datadog agent is included directly in your container, cutting down on manual configuration steps.
- Enhanced Monitoring: It offers more in-depth insights into your containerized setups, effortlessly collecting metrics, logs, and traces.
- Adaptability: Docker integration grows naturally with your containerized applications, making it a great fit for dynamic and scalable environments.
While API integration might suit certain specific needs, Docker integration is often the go-to option for teams working with containerized workflows on Render.
How do I securely manage my Datadog API key when setting up monitoring on Render?
When setting up your Datadog API key, it's crucial to generate an organization-scoped API key designed specifically for this task. Using application keys or user-specific API keys can pose risks by potentially exposing sensitive access.
To keep your API key safe, store it in a secure location like environment variables or a secrets management tool. Avoid hardcoding the key into your application or sharing it publicly under any circumstances.
How can I manage Datadog costs while monitoring applications on Render?
To keep Datadog costs under control while monitoring applications on Render, it's all about managing your data usage smartly. Start by cutting down on unnecessary logs - filter out the ones you don't need. Adjust metric cardinality to avoid tracking overly detailed data, and set clear log retention policies to prevent storing information longer than necessary. Be cautious with custom metrics; they can be helpful but might also lead to redundant data and extra expenses.
You can also make your data collection more efficient by using tags and filters. This way, you're only tracking the information that truly matters. It’s a good idea to work with your Datadog sales representative - they can help you explore cost-saving options tailored to your needs. And don’t forget to regularly review your usage. This habit can uncover optimization opportunities, ensuring you get the most out of Datadog without overspending.


