
Improving API Latency With Datadog Integrations
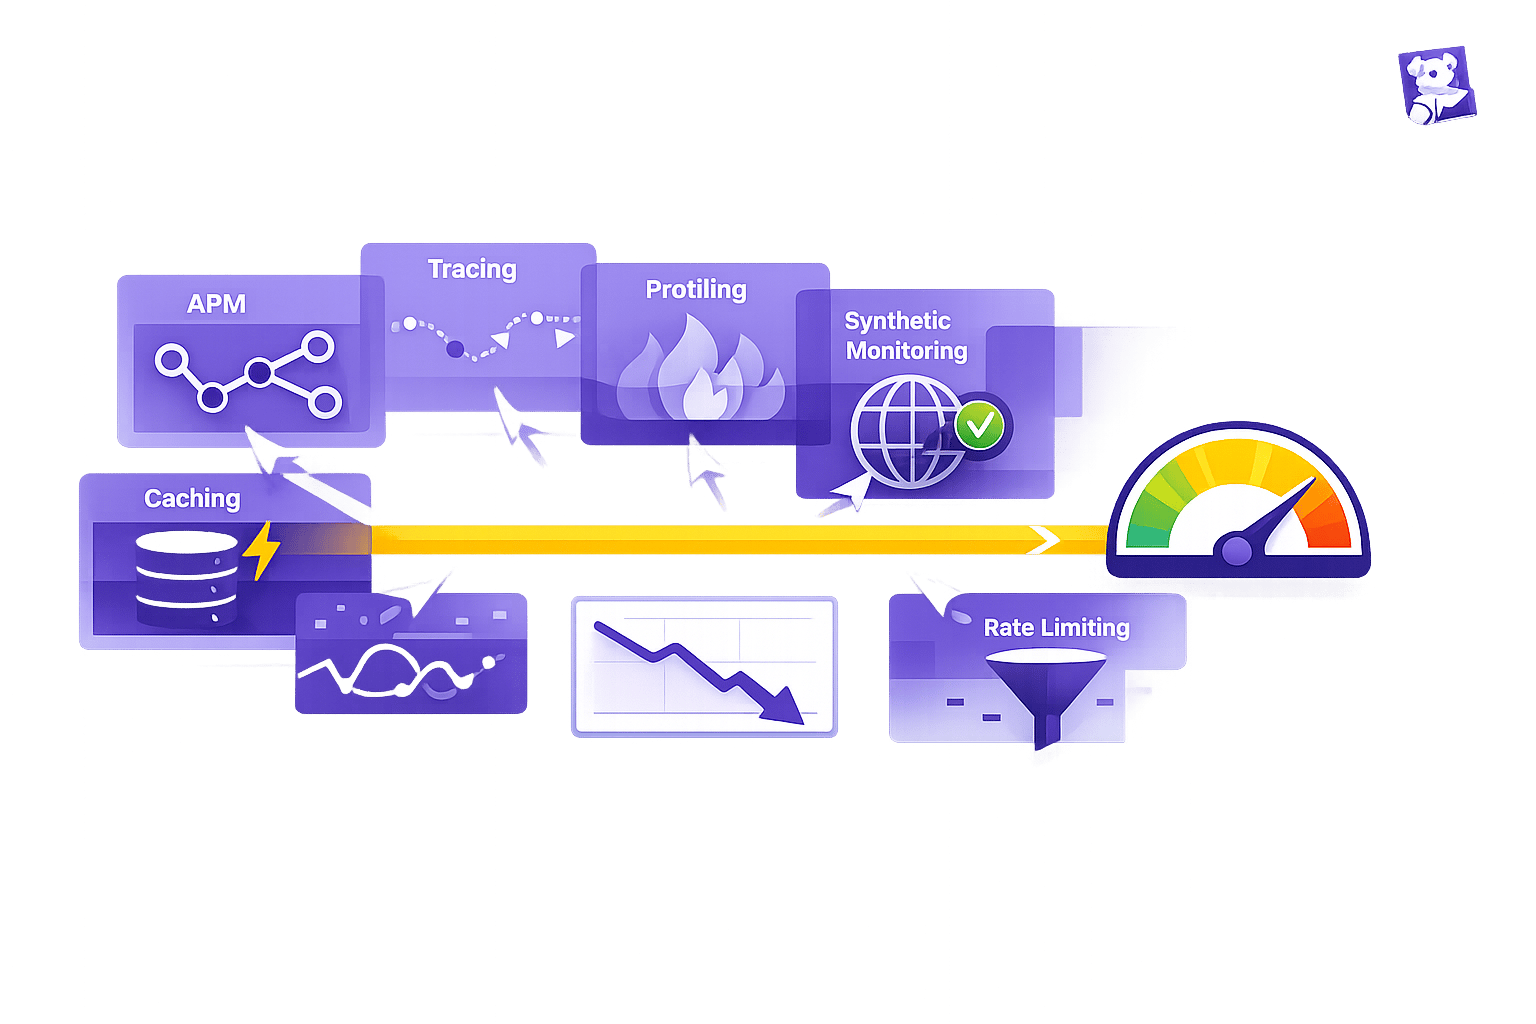
Use Datadog integrations—APM, tracing, profiling, and synthetic monitoring—plus caching and rate limiting to reduce API latency and pinpoint bottlenecks.
API latency - the time it takes for a request to get a response - can make or break user experience, especially for small and medium-sized businesses (SMBs). Slow APIs (just 3–4 seconds of delay) can drive users away, hurt revenue, and breach Service Level Agreements (SLAs). Fixing latency often means balancing performance improvements with operational costs, like scaling infrastructure.
Datadog simplifies this challenge by offering tools to monitor and optimize API performance. Key features include:
- Continuous Profiler: Detects off-CPU bottlenecks like I/O wait times and garbage collection stalls.
- Distributed Tracing: Links specific code to performance issues, making debugging faster.
- Synthetic Monitoring: Tests API endpoints globally to catch latency issues before users notice.
- Watchdog AI: Automatically flags anomalies and provides root cause analysis.
Setting up Datadog involves integrating cloud services, installing the Datadog Agent, and configuring tools like APM tracing and Synthetic Monitoring. To improve latency further, SMBs can implement caching to reduce redundant operations and rate limiting to manage traffic surges. Dashboards and alerts help track key metrics like p95 and p99 latency, ensuring quick detection and resolution of performance issues.
For SMBs, Datadog offers enterprise-level tools to reduce latency without overspending on infrastructure. By using these tools effectively, businesses can improve user experience, protect SLAs, and keep costs under control.
Improve request latency for Go applications with Datadog APM & Continuous Profiler
Setting Up Datadog Integrations for API Monitoring
5-Step Guide to Configuring Datadog Integrations for API Monitoring
Getting Datadog integrations right is key to improving API latency and maintaining consistent performance.
Key Datadog Integrations for API Monitoring
Integrations form the backbone of effective API monitoring. Datadog supports over 1,000 built-in integrations and is trusted by more than 30,500 customers to oversee their infrastructure.
For small and medium-sized businesses, a few integration types stand out. Cloud provider integrations - such as Amazon API Gateway, Azure API Management, and Google Cloud APIs - are essential for managed API services. These integrations automatically collect critical metrics like latency, error rates, and request counts. For APIs passing through gateways or proxies, tools like Kong, NGINX, MuleSoft, or HAProxy help monitor request flow at the entry point.
Synthetic Monitoring is another must-have, allowing you to test API endpoints using HTTP, gRPC, and WebSocket protocols from various global locations. Meanwhile, Application Performance Monitoring (APM) uses distributed tracing to identify bottlenecks in application code and downstream dependencies.
When it comes to infrastructure, integrations with Kubernetes, Docker, or AWS Lambda ensure that resource limitations in containerized workloads don’t go unnoticed. If you're using a Content Delivery Network (CDN) like Cloudflare, Akamai, or Fastly, these integrations can help optimize latency at the edge.
Step-by-Step Guide to Configuring Datadog Integrations
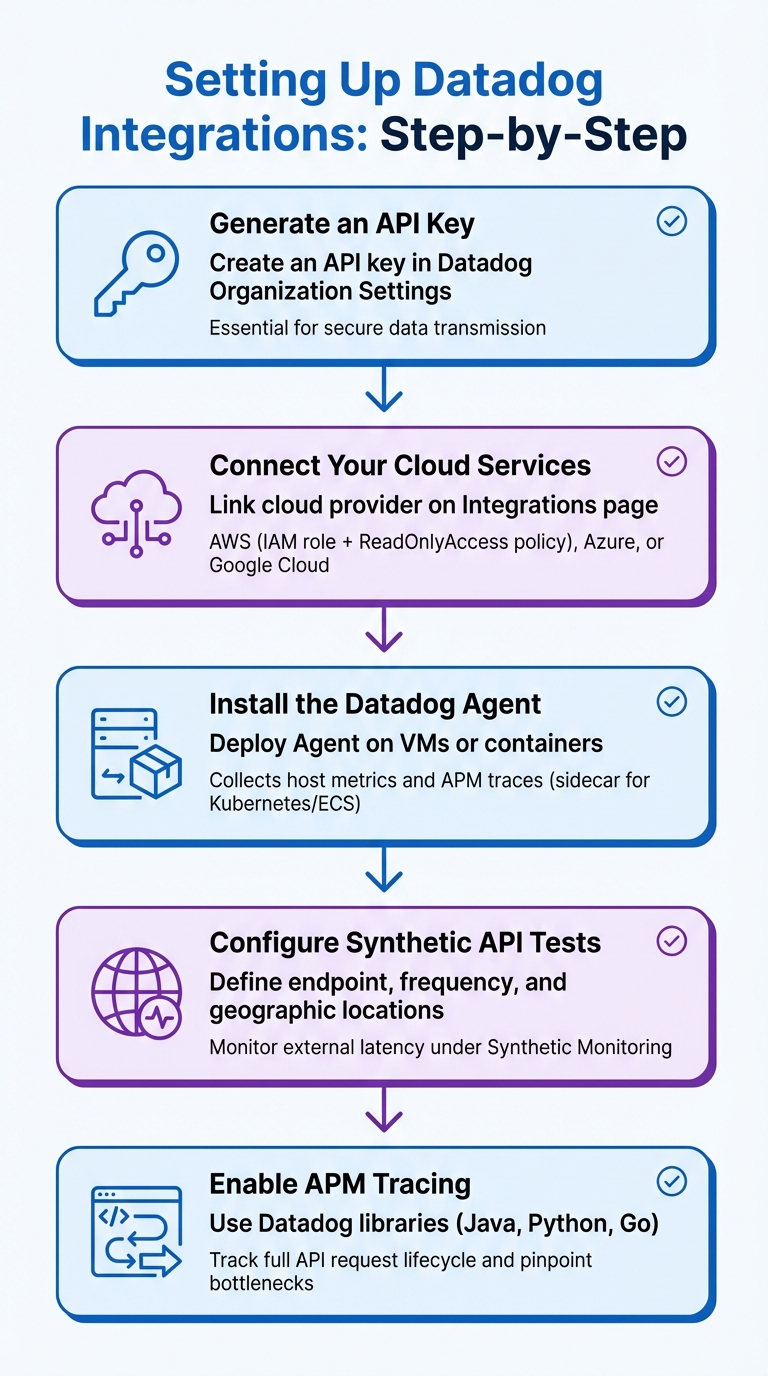
Here’s how to set up your Datadog integrations effectively:
- Generate an API Key: Start by creating an API key in your Datadog Organization Settings. This key is essential for securely transmitting data from the Datadog Agent and other integrations.
-
Connect Your Cloud Services: On the Integrations page, link your cloud provider. For AWS, this involves setting up an IAM role with the
ReadOnlyAccesspolicy, enabling Datadog to access metrics from services like Amazon API Gateway. Azure and Google Cloud require similar configurations using service accounts and permissions. - Install the Datadog Agent: Deploy the Datadog Agent on your virtual machines or containers. This agent collects host-level metrics and acts as a gateway for APM traces. For containerized setups, run the Agent as a sidecar in Kubernetes or Amazon ECS.
- Configure Synthetic API Tests: Under Synthetic Monitoring, define your API endpoint, set the check frequency, and choose geographic locations to monitor external latency.
- Enable APM Tracing: Use Datadog libraries for supported languages like Java, Python, or Go to instrument your application code. This enables you to track the full lifecycle of API requests and pinpoint bottlenecks.
Following these steps ensures you have the tools in place to monitor and optimize API latency effectively.
Common Setup Mistakes and How to Avoid Them
To ensure smooth integration, avoid these common mistakes:
-
Permission Errors: These are a frequent issue. Double-check that roles for cloud integrations have the correct access policies. Also, use unified service tagging (
env,service,version) to filter API latency data by environment or version. - NTP Synchronization Problems: If your server clocks are out of sync, metrics may be rejected or display incorrectly. Make sure your servers are using NTP to maintain accurate time.
- Network Restrictions: Firewalls or proxies can block the Datadog Agent from communicating with the platform. If this happens, whitelist Datadog's IP ranges or set up the Agent to work through a proxy.
If you encounter issues, tools like Agent Flare and Agent Check Status are available to troubleshoot and diagnose problems during setup. These steps can help you avoid common pitfalls and get your integrations running smoothly.
Configuring Metrics and Traces for Latency Analysis
Once you've set up integrations, keeping an eye on detailed metrics and traces becomes essential for staying ahead of API latency issues.
Key Metrics for Monitoring API Performance
When it comes to analyzing API latency, a few metrics stand out as critical: response time (latency), request throughput (requests per second), and error rates. That said, tracking latency percentiles - like p50, p75, p90, p95, and p99 - is equally important. These percentiles help you understand how latency impacts users across the board, including those experiencing the slowest responses.
A key distinction to grasp is the difference between CPU time and wallclock time, as this can make or break your root cause analysis. Richard Startin, a Senior Software Engineer at Datadog, puts it this way:
"Lots of profiling data focuses on CPU time, but the cause of your latency problem may be related to time spent off CPU instead."
To dig deeper into off-CPU latency, monitor threads in states like BLOCKED, TIMED_WAITING, and WAITING. For Java-based applications, it's also essential to track Garbage Collection (GC) events, heap size, and allocation stalls to uncover memory-related slowdowns.
Using Distributed Tracing to Find Latency Issues
Metrics give you the big picture, but distributed tracing takes it a step further by mapping out the request flow and pinpointing exactly where delays occur. With tools like Datadog's distributed tracing, you can see how time is spent - or wasted - as each API request moves through your system. By linking traces to profiles, you can connect span IDs to profiling samples, helping you identify the specific code frames responsible for latency in a given request.
A trace timeline makes it easy to distinguish between parked wall time and active CPU time, showing where requests are stuck versus actively processing. If performance lags despite low CPU usage, wallclock profiling can highlight where threads are parked or blocked. For example, when "Runnable" wall time far exceeds CPU time, it often points to threads competing for a limited number of vCPUs, creating scheduling bottlenecks. Flame graphs can also be filtered to focus on specific slow endpoints, making it easier to target problem areas instead of analyzing the entire service profile.
For Java teams using ZGC, monitoring events like ZPageAllocator::alloc_page_stall() can reveal if the heap size is too small for your workload, causing the JVM to throttle threads. Additionally, Datadog's Watchdog Insights can automatically flag issues with cloud or SaaS APIs, bringing latency problems to light.
These tracing tools integrate seamlessly with dashboards, turning raw data into actionable latency insights.
Customizing Dashboards for API Latency Insights
Custom dashboards are your go-to for visualizing API performance. The APM Stats Widget, for instance, lets you track key metrics like latency percentiles, request throughput, and error rates - all in one place.
With template variables, you can dynamically filter dashboards by environment, service, host, or custom tags, making it easier to isolate latency issues. Heatmaps are another handy tool, offering a clear view of response time distributions to spot long-tail latency and outliers.
To stay ahead of performance regressions, use the timeshift function to compare current latency against historical trends. Adding event overlays to your graphs can also help you correlate latency spikes with specific system events, such as code deployments or configuration changes.
For better organization, group dashboards by API microservices or endpoints, making it easier to navigate during incidents. You can also set up top-list widgets with conditional formatting - like highlighting latency over 500 ms in red - for quick visual cues on API health. Including widgets for runtime-specific metrics, such as JVM garbage collection stats or Python thread counts, alongside latency graphs can help pinpoint internal bottlenecks. These dashboard configurations lay the groundwork for targeted optimizations that directly improve API response times for small and medium-sized businesses.
Implementing Caching and Rate Limiting
Once you've analyzed your metrics in detail, the next logical step is to tackle latency head-on. By using caching and rate limiting, you can actively reduce system load and prevent delays, building on the foundation of your monitoring setup.
How Caching Reduces API Latency
Caching works by storing frequently requested data in memory, cutting out repetitive queries and external calls that can slow down response times. This not only improves performance but also helps reduce infrastructure costs - especially for small and medium-sized businesses.
For example, Datadog's wallclock profiler can help identify off-CPU waits and highlight endpoints where caching would have the most impact. In Java, issues like ZGC stalls (e.g., ZPageAllocator::alloc_page_stall()) often point to memory allocation delays that slow things down. By implementing caching, you can reduce these memory-heavy operations and speed up responses.
Another useful tactic is correlating trace context with profiling samples by linking them to span IDs. This allows you to zero in on which endpoints would benefit most from caching. To refine your approach further, monitor cache hit rates and use tracer-managed thread filters to focus on threads actively serving requests. These steps can significantly sharpen your latency optimization efforts.
Rate Limiting Strategies to Improve API Performance
Rate limiting helps ensure consistent API performance by controlling how many requests your system accepts within a set timeframe. Without it, sudden traffic surges can overwhelm your system, leading to higher latency or even outages.
To implement rate limiting, start by understanding your API's capacity and typical usage patterns. Use Datadog's throughput metrics to determine realistic rate limits based on live traffic. Once these limits are in place, your API should return standard rate limit headers to clients, such as:
| Rate Limit Header | Description |
|---|---|
| X-RateLimit-Limit | Maximum requests allowed during the time window |
| X-RateLimit-Remaining | Requests still available in the current window |
| X-RateLimit-Reset | Time (in seconds) until the counter resets |
| X-RateLimit-Period | Duration of the rate limit window in seconds |
Optimizing Dashboards and Alerts for Real-Time Latency Improvements
Once caching and rate limiting are in place, the next step is to quickly detect and resolve latency issues. Properly configured dashboards and alerts turn raw monitoring data into actionable insights, helping your team stay ahead of potential performance bottlenecks.
Creating Real-Time Alerts for Latency Thresholds
Effective alerts rely on monitoring the right metrics at the right thresholds. Focusing solely on average latency won't give you the full story - high percentiles like p95 and p99 are essential for identifying worst-case scenarios. For example, while your average response time might hover around 200 ms, a p99 latency of 2 seconds signals that a small but critical portion of users is facing major delays.
Set up multi-threshold alerts with both "Warning" and "Critical" levels to catch issues early. For instance, you might configure warning alerts for p99 latency exceeding 500 ms and critical alerts for p99 surpassing 1 second. If your APIs experience seasonal traffic spikes or irregular patterns, consider using anomaly detection monitors powered by machine learning. These monitors analyze historical data to flag unusual latency increases, even when specific limits aren't crossed. To streamline incident response, scope your monitors with unified service tags like env, service, and version. Then, integrate these alerts with tools like Slack, Microsoft Teams, or PagerDuty to ensure your team receives immediate notifications.
Once alerts are in place, customized dashboards can help you dive deeper into latency analysis.
Dashboard Customization Tips
Custom dashboards take your monitoring to the next level by translating raw data into real-time insights. Start by adding APM Stats Widgets to display latency metrics across key percentiles (p50 to p99). Use template variables to filter data dynamically by environment, service, data center, or version.
Leverage the timeshift function and deployment overlays to compare current performance with historical trends and pinpoint code releases that may have caused latency spikes. To add an external perspective, include Synthetic API test widgets showing response times and uptime from various global locations. Additionally, enable Watchdog Insights on your dashboards to automatically detect anomalies and correlate latency spikes with system changes - no manual setup required.
Advanced Profiling Techniques for Endpoint Bottlenecks
Once you've set up dashboards and alerts, the next step is tackling code-level issues with advanced profiling tools. If your dashboards point to ongoing latency problems, Datadog's profiling tools can help break down where your API endpoints are spending time - whether it's processing requests or waiting for resources.
Using APM for Deep Performance Analysis
Datadog's Application Performance Monitoring (APM) provides detailed performance tracking for specific API routes, such as GET /api/users or POST /checkout. This level of detail allows you to narrow your focus to the problematic API calls, rather than relying on high-level service metrics.
Flame graphs, combined with span ID correlation, are particularly useful for identifying delays at the code level. These tools let you connect profiling samples with specific spans and API endpoints. You can even filter flame graphs by endpoint to pinpoint which methods are consuming the most time during a request.
"Using profilers can be frustrating because engineers typically use the wrong type of profile for analysis. Lots of profiling data focuses on CPU time, but the cause of your latency problem may be related to time spent off CPU instead."
– Richard Startin, Senior Software Engineer, Datadog
Wallclock profiling provides a more comprehensive view by including time spent waiting on I/O, dealing with locks, or stalled during memory allocation. For example, in one case where response times were around 3–4 seconds, CPU-only profiling missed half the activity because the delay was caused by memory allocation stalls in Java's Z Garbage Collector. Datadog's tracer-managed thread filtering also helps by focusing profiling on threads with active trace contexts, cutting out noise from idle or background threads. If you see a big gap between RUNNABLE wall time and actual CPU usage, it could indicate that your threads are competing for too few vCPUs - suggesting the need for better resource allocation rather than code changes.
Analyzing Logs for Latency Patterns
Profiling can show you where the delays are, but logs help explain why and when those delays happen. By correlating logs with traces - using trace_id and span_id injected into your application logs - you can jump directly from a slow trace in APM to the specific log entries tied to that request.
To make logs more actionable, use log pipelines and Grok parsing to extract structured data from raw log entries. For instance, parsing a line like "request_time: 500ms" turns it into a searchable attribute. These attributes can then be used to filter and group logs in the Log Explorer, helping you identify which endpoints or user segments are experiencing higher latency.
Consistently applying unified service tagging with env, service, and version tags across logs, traces, and metrics ensures you can analyze latency trends across all telemetry types without losing context. For APIs with heavy traffic, you might generate log-based metrics to monitor latency trends over time while keeping only a sampled set of log records.
Datadog Watchdog adds another layer by detecting anomalies in logs - like sudden spikes in error rates or the appearance of latency-related keywords that often signal performance issues.
| Profiling Type | What It Shows | Best For Identifying |
|---|---|---|
| CPU Profiling | On-CPU execution time | Heavy computation, inefficient algorithms, high-frequency method calls |
| Wallclock Profiling | Total time (on + off CPU) | I/O wait, lock contention, thread stalls, resource competition |
| Distributed Tracing | Request flow across services | Latency between services, slow database queries, external API delays |
Conclusion
Key Takeaways for SMBs
To improve API latency, focus on addressing the root causes of delays rather than simply adding more resources. Tools like Datadog provide small and medium-sized businesses (SMBs) with enterprise-level observability without the complexity or high costs.
By leveraging Datadog's capabilities, SMBs can achieve noticeable performance gains. Use features like wallclock profiling, distributed tracing, and trace-profile correlation to identify and resolve bottlenecks. As Richard Startin, Senior Software Engineer at Datadog, explains:
"It's quite rare for a Java service to be at its efficient frontier, and there's usually low hanging fruit surfaced by continuous profiling which can sometimes reduce latency and cost simultaneously."
For SMBs working with limited budgets, these strategies are especially valuable. Performance improvements can often be achieved without investing in additional infrastructure. For example, increasing heap size can address allocation stalls, while right-sizing instances can resolve thread competition for vCPU time. These optimizations not only enhance system performance but also help reduce cloud expenses.
Start by setting up integrations, implementing unified service tagging (env, service, version), and creating targeted dashboards. Align these steps with your operational goals to drive meaningful improvements. Advanced techniques like synthetic monitoring can catch issues before they affect users, while continuous profiling helps uncover opportunities to lower latency and reduce costs. Take advantage of Datadog's integrations and explore their 14-day free trial to see these benefits in action.
FAQs
How can Datadog's Continuous Profiler help improve API response times?
Datadog's Continuous Profiler keeps an eye on your code in real-time, helping you spot inefficiencies and bottlenecks that can drag down API response times. By diving into production environments, it highlights critical areas in your code that can be optimized for quicker, more dependable API performance.
This is especially handy for small and medium-sized businesses aiming to refine their systems without interrupting live operations. The result? Smoother performance and a better experience for your users.
How does Synthetic Monitoring help improve API performance?
Synthetic Monitoring boosts API performance by simulating user traffic to evaluate availability, response times, and functionality across various locations and devices. This method helps teams proactively spot and fix potential issues before they impact users, ensuring APIs run smoothly and reliably.
By imitating specific user interactions, Synthetic Monitoring uncovers detailed insights into performance differences across regions or networks, making it easier to fine-tune API responsiveness. It also supports continuous, automated testing without relying solely on real user data, allowing teams to quickly identify and resolve problems. This approach helps reduce downtime and keeps systems running dependably, making it an essential tool for delivering reliable APIs and seamless user experiences.
What are the best practices for SMBs to use caching and rate limiting to improve API latency?
To improve API latency, small and medium-sized businesses (SMBs) can make smart use of caching and rate limiting.
Caching temporarily stores frequently accessed data, cutting down on repetitive API calls and speeding up response times. For best results, focus on caching data that doesn’t change often. Be sure to set expiration policies thoughtfully - this keeps the cached data fresh while maintaining efficiency.
On the other hand, rate limiting helps manage the number of API requests sent within a specific period. This not only prevents exceeding usage quotas but also ensures steady performance. Tools like Datadog can be helpful for tracking metrics such as X-RateLimit-Limit and X-RateLimit-Remaining in real time. To handle HTTP 429 errors (caused by too many requests), consider implementing strategies like exponential backoff, which spaces out retries and prevents overloading the API during high-traffic periods.
By combining these methods, SMBs can improve API performance, minimize latency, and maintain dependable system operations.


