Interactive Dashboards in Datadog
Learn how to create and manage interactive dashboards that unify metrics, logs, and traces for better decision-making and performance tracking.
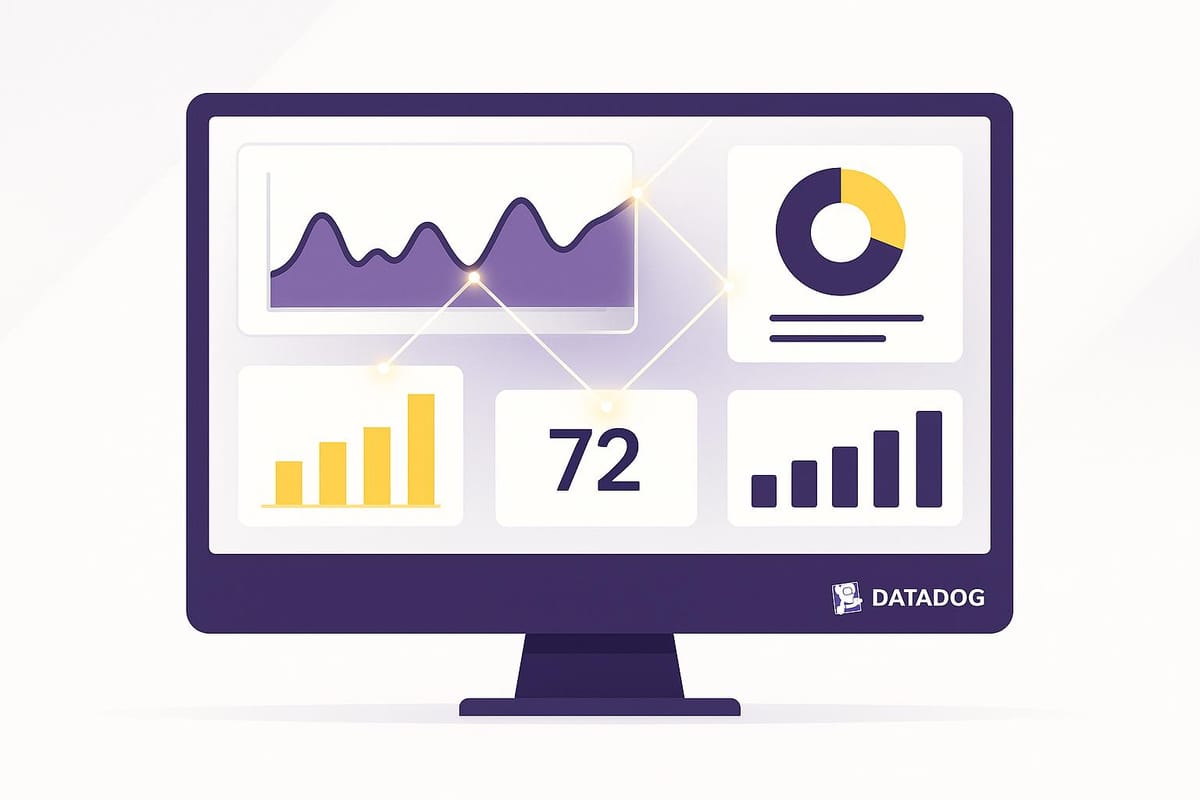
Datadog's interactive dashboards help you monitor and improve your infrastructure by unifying metrics, logs, and traces into a single view. These dashboards simplify complex data, making it actionable for better decision-making. Key features include:
- Filtering: Focus on specific time ranges, services, or environments.
- Real-Time Correlation: Compare metrics side by side instantly.
- Collaboration Tools: Share insights easily with your team.
- Custom Alerts: Set notifications for specific thresholds.
To create dashboards, ensure proper user permissions, connect data sources, and implement consistent tagging. Use widgets like Timeseries or Heatmaps, and organize layouts for clarity. Enhance navigation with widget links and maintain dashboards with backups and regular updates.
Datadog dashboards are perfect for SMBs aiming to streamline operations and track performance effectively.
Datadog Dashboards Explained | Datadog Overview | Datadog Dashboard | Datadog Data Visualization-06
Setup Requirements
Before diving into dashboard creation, it's important to set up the foundational components to ensure everything runs smoothly and provides meaningful insights.
User Access and Permissions
Setting up proper user permissions is crucial for keeping dashboards secure and ensuring efficient workflows. Datadog uses role-based access control (RBAC) to manage permissions. To create or edit dashboards, users need at least the "Dashboard Editor" role.
Here’s a suggested permission setup for small to medium-sized businesses (SMBs):
| Role | Permissions | Typical Users |
|---|---|---|
| Admin | Full control: manage, share, and delete dashboards | Technical leads, DevOps managers |
| Editor | Create and modify dashboards | Engineers, analysts |
| Viewer | View-only access | Stakeholders, team members |
Connecting Data Sources
To populate your dashboards with data, you’ll need to connect your sources through the Datadog Agent and pre-built integrations. The Datadog Agent is lightweight, consuming less than 1% of CPU and around 200MB of RAM.
Follow these steps to get started:
- Install the Datadog Agent: Deploy the agent across your infrastructure.
- Configure Integrations: Choose from Datadog’s extensive library of over 500 integrations to connect your tools and systems.
- Set Up APM: Instrument your application code to enable Application Performance Monitoring (APM).
- Enable Log Collection: Collect logs for a complete view of your system’s performance.
Implementing Tags
Tags are essential for organizing and filtering data on your dashboards. A consistent tagging strategy helps you create dynamic dashboards that can grow with your business.
Here are some key tags to consider:
| Tag Type | Example | Purpose |
|---|---|---|
| Environment | environment:production |
Differentiate between deployment stages |
| Service | service:payment |
Identify specific application components |
| Business Context | customer_tier:premium |
Track metrics relevant to business goals |
| Technical | instance-type:t2.micro |
Monitor infrastructure details |
To streamline tagging, use automation tools like infrastructure-as-code. Define standardized tags that align with your business objectives to ensure consistency across your system.
Once these steps are complete, you’re ready to start building your dashboard.
Building a Dashboard
Let’s dive into creating a dashboard tailored specifically for SMB monitoring in Datadog. This guide will walk you through the essentials, from choosing the right dashboard type to organizing your layout effectively.
Selecting Dashboard Types
Datadog provides two main types of dashboards, each designed to meet specific monitoring needs:
| Dashboard Type | Best For | Key Features |
|---|---|---|
| Timeboards | Real-time monitoring | Fixed time window, automatic refresh, uniform time controls |
| Screenboards | Status displays | Custom layouts, mixed time windows, and options for easy sharing |
For SMBs, timeboards are often the go-to choice. They provide a consistent time-series view, making them perfect for troubleshooting and tracking performance metrics.
Setting Up Widgets
Widgets are the building blocks of your dashboard. Here’s a quick breakdown of some key widget types and how to use them:
| Widget Type | Use Case | Configuration Tips |
|---|---|---|
| Timeseries | Resource usage trends | Set y-axis bounds to improve visibility and focus on key data points |
| Query Value | Key performance metrics | Apply conditional formatting to highlight thresholds or anomalies |
| Heatmap | Traffic patterns | Group data by relevant tags (e.g., customer_tier) for clearer insights |
| Top List | Resource consumption | Limit the list to the top 5-10 items to avoid overwhelming the display |
Steps to Add a Widget:
- Click the "Add Widget" button in your dashboard.
- Choose the widget type that matches your use case.
- Configure your data query using the query editor.
- Set up display options and thresholds for better readability.
- Drag and position the widget on your dashboard to suit your layout.
Organizing Dashboard Layout
An organized layout ensures your dashboard is easy to navigate and interpret. Here are some tips to structure it effectively:
- Group Related Metrics: Arrange your dashboard into sections based on system aspects. For example, place customer-facing metrics at the top, with infrastructure metrics below.
- Size According to Importance: Allocate larger widget sizes to critical metrics. Here's a suggested size distribution:
| Metric Importance | Widget Size | Position |
|---|---|---|
| Critical KPIs | 12x8 | Top row |
| Supporting metrics | 6x4 | Middle section |
| Detailed data | 4x4 | Bottom section |
- Maintain a Visual Hierarchy: Start with high-level metrics to give users an overview, then include detailed data for deeper analysis. This structure helps users quickly spot issues and dig into their causes.
To ensure usability, stick to a 12-column grid, keep the most critical widgets visible without scrolling, and test your layout on different devices. Adjust refresh rates based on the type of data - set it to 30 seconds for real-time monitoring or 5 minutes for general metrics.
Next, we’ll look at embedding interactive features to enhance your dashboard's functionality and insights.
Adding Interactive Features
Enhance your dashboard's functionality by incorporating interactive navigation features. These additions allow for smooth transitions between dashboards and external resources, making data exploration more intuitive.
Setting Up Widget Links
-
Creating Source Widget Links
Open the widget's configuration panel and select the "Link to" option. From there, you can connect the widget to other dashboards, log queries, or APM service pages, depending on your needs. -
Customizing Link Behavior
Adjust the link settings to retain essential context, such as template variables, timeframes, tags, and filters. This ensures consistency when navigating between views and keeps the data relevant. -
Testing the Navigation Flow
Test the links to confirm they preserve the current context and lead to the intended destinations. Double-check that the navigation paths provide actionable insights without breaking the flow.
Dashboard Management
Managing dashboards in Datadog effectively is all about finding the right balance between performance, accessibility, and ongoing maintenance.
Speed and Efficiency
To keep dashboards running smoothly:
- Focus on actionable insights when adding widgets.
- Use template variables to combine multiple dashboards into one.
- Set appropriate refresh intervals - 1 minute for critical metrics, 5 minutes for secondary ones.
- Apply rollup functions to simplify historical data analysis.
The speed of a dashboard depends on factors like the number of widgets, the complexity of queries, and the time range being analyzed. For example, a manufacturing SMB managed to cut dashboard load times by 60% by merging 12 separate dashboards into a single one, using template variables to switch between production lines.
Team Access Control
Here’s how to manage dashboard access effectively:
| Access Level | Permissions | Recommended For |
|---|---|---|
| Admin | Full edit and share | Dashboard maintainers |
| Edit | Modify existing dashboards | Team leads |
| View | Read-only access | General team members |
To ensure smooth collaboration, standardize dashboard naming conventions, tag dashboards by department, review permissions quarterly, and apply the principle of least privilege.
Backup and Updates
A solid backup and update strategy is critical for maintaining dashboards:
- Automated Backups: Use Datadog's API to export dashboard configurations daily and store them in version control systems.
-
Update Strategy:
- Test all changes in non-production environments.
- Perform a monthly review to assess dashboard performance.
- Gather user feedback to identify improvement areas.
- Log all changes in a changelog to track updates.
- Version Control: Manage dashboard definitions using infrastructure-as-code tools. Back up critical dashboards weekly and immediately after significant updates.
Summary
This section pulls together the key steps outlined earlier, emphasizing the essentials for effective dashboard management. Start with clear user permissions, reliable data connections, and consistent tagging practices. The success of your dashboard hinges on selecting the right visual elements and arranging widgets in a logical, user-friendly way.
Here’s what to prioritize for better performance and clarity:
- Set up role-based access with specific permission levels, and ensure data sources refresh at consistent intervals.
- Highlight key metrics using layouts tailored to the needs of different teams.
- Use filters and widget links to make data exploration and navigation seamless.
- Schedule regular backups and updates while maintaining version control to keep your dashboard running smoothly.
FAQs
What steps should SMBs take to set up the correct user permissions before creating dashboards in Datadog?
Before creating dashboards in Datadog, it's important for SMBs to review their team's user roles and access requirements. Datadog offers predefined roles like Admin, Standard, and Read-Only, which can be assigned based on the level of access each team member needs.
Once roles are assigned, double-check that users have the proper permissions to create, edit, or view dashboards. You can manage this through the Team Management section in Datadog, where role-based access controls (RBAC) can be tailored to fit your team. Setting up permissions correctly not only safeguards your data but also prevents unauthorized changes to critical dashboards.
By aligning user permissions with operational needs, SMBs can enhance collaboration and make their dashboards more effective for team use.
How can I keep my Datadog dashboards effective and up-to-date?
To keep your Datadog dashboards effective and aligned with your team's goals, it's important to review and update them regularly. Start by clearing out any outdated widgets or metrics that no longer serve a purpose. Replace them with data that directly supports your current priorities and monitoring needs.
Focus on making your dashboards easy to use. Arrange widgets in a way that makes sense, and use clear labels, colors, and visuals to emphasize the most important insights. Periodically test how well the dashboards perform, tweaking filters or time ranges as needed to ensure the data stays relevant and easy to interpret.
Lastly, involve your team in the process. Gather their input to make sure the dashboards remain useful and practical for everyday tasks. This collaborative approach ensures the dashboards continue to serve their purpose effectively.
How can widget links improve the functionality of Datadog dashboards, and what are some practical examples?
Widget Links in Datadog Dashboards
Widget links in Datadog dashboards let you connect widgets to each other or to external resources, creating a more interactive and seamless experience. These links make it easier to navigate, explore specific data, or access related tools and dashboards directly from your dashboard.
For instance, you can link a graph widget to a detailed log analysis dashboard, allowing for quicker troubleshooting. Similarly, a status widget could link to an external knowledge base or documentation, speeding up issue resolution. These connections make dashboards more efficient, helping teams quickly find the insights they need to make better decisions.

