Log Enrichment with Datadog: Step-by-Step Guide
Learn how to enrich logs in Datadog for better insights and faster troubleshooting with our comprehensive step-by-step guide.
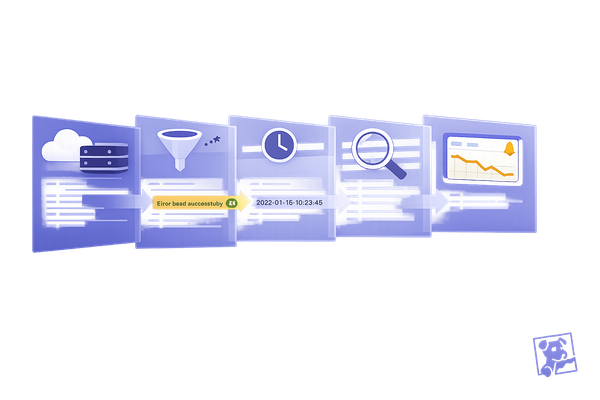
Log enrichment in Datadog transforms raw logs into actionable insights by adding context like metadata and user details. This process helps businesses troubleshoot faster, comply with regulations, and improve monitoring without heavy development efforts. Here's what you need to know:
- Purpose: Adds context (e.g., user data, IP locations) to logs for better analysis.
- Setup: Requires proper permissions, API keys, and supported log sources like AWS, Azure, or on-premises systems.
- Methods: Use Datadog agents, APIs, or cloud-native integrations for log collection.
- Enrichment Tools: Includes Grok patterns, JSON parsing, reference tables, and built-in processors to structure and enhance logs.
- Validation: Use Datadog's Log Explorer to test and ensure enrichment rules work as intended.
- Best Practices: Standardize naming conventions, monitor enrichment performance, and set alerts for errors or processing delays.
This guide simplifies the process of turning raw logs into a system that supports faster troubleshooting and better decision-making.
L04.3 Master Datadog Log Pipelines: Remappers, Processors & Best Practices 🚀
Prerequisites and Setup Requirements
Building a secure and compatible foundation in Datadog is critical for effective log enrichment. Start by ensuring security and permissions are properly configured.
Datadog Account and Permissions
Your team will need the right access levels to configure log enrichment without compromising security. Stick to the principle of least privilege - only grant the permissions necessary for each team member's role. For the initial setup, which involves creating and modifying log pipelines and processors, administrative access is usually required. Once the setup is complete, most users can operate with restricted, log-specific permissions.
For automated log forwarding, use dedicated service accounts. Retrieve API keys from the Organization Settings page and store them securely using a secret management tool. Avoid embedding API keys directly into configuration files to minimize security risks.
If several team members need access to log configurations, consider creating custom roles tailored to log pipeline management tasks. This approach ensures that broad administrative access is restricted while still allowing efficient collaboration.
After permissions are set, review supported log sources and confirm API key configurations to complete your setup.
Supported Log Sources and API Keys
Datadog supports a wide range of log sources across cloud, on-premises, and hybrid environments. Integration options include language-specific libraries, cloud-native connectors, and widely-used log shippers.
For cloud setups, Datadog offers native integrations with major platforms:
- Amazon Web Services: Use Data Firehose, S3, or Lambda Forwarder.
- Microsoft Azure: Integrate via Event Hubs.
- Google Cloud Platform: Forward logs through Pub/Sub.
On-premises systems are covered as well. The Datadog Agent supports log collection on Windows, macOS, and various Linux distributions. It also works seamlessly with containerized environments like Docker, Kubernetes, and Amazon ECS.
If you're already using log shippers such as Filebeat, Fluent, Logstash, or Splunk, you can forward logs to Datadog using standard protocols like HTTP, Syslog, or Socket connections. Additionally, Datadog's Real User Monitoring (RUM) SDKs capture client-side logs and user activity across both web and mobile applications.
For more complex setups, Datadog Observability Pipelines allow you to ingest logs from multiple sources, apply transformations, and then forward them to Datadog Logs. This centralized processing ensures streamlined log management.
With these integrations in place, you're ready to configure your log ingestion pipeline.
US-Specific Formatting Considerations
To ensure your team can quickly interpret log data, standardize formats for US-based operations.
- Use MM/DD/YYYY for dates and 12-hour AM/PM time notation.
- Represent currency with the dollar sign and comma separators (e.g., $1,250.99).
- Follow imperial units for measurements and standard number formatting with commas and decimals (e.g., 1,234.56).
Applying consistent formatting across all log sources helps create a unified experience, reducing confusion and potential errors during incident response.
Step-by-Step Log Enrichment Process in Datadog
With your prerequisites and formatting standards ready, you can now create a log enrichment workflow that transforms raw logs into actionable insights.
Setting Up the Log Ingestion Pipeline
Start by selecting a log collection method that fits your infrastructure.
- Direct Agent Installation: This method works well for most server and container setups. Install the Datadog Agent on your servers, containers, or cloud instances. In environments like Docker or Kubernetes, the Agent operates as a sidecar or DaemonSet, gathering logs from all active containers.
- API-Based Log Submission: If deploying agents isn't an option, you can send logs directly to Datadog's HTTP API. Use dedicated SDKs available for languages like C#, Go, Java, Node.js, PHP, Python, and Ruby.
-
Cloud-Native Integrations: For cloud-based setups, automate log collection by enabling integrations. For example:
- AWS users can collect logs from CloudTrail, VPC Flow Logs, and Lambda functions.
- Azure users can forward logs via Event Hubs.
- Google Cloud Platform users can connect through Pub/Sub.
For environments with multiple data sources, you can use Observability Pipelines to centralize log processing. Configure these pipelines in the Datadog interface under Settings > Log ingestion pipelines.
Once your logs are collected, the next step is to set up parsing rules to structure them for better search and analysis.
Configuring Log Parsing Rules
Raw logs often arrive as unstructured text, which makes them hard to analyze. Parsing rules help extract meaningful fields, turning chaotic text into structured data that's easier to query and visualize.
- When using integrations for services like Apache, NGINX, or PostgreSQL, pre-configured parsing rules automatically extract standard fields such as response codes, request methods, and execution times.
-
Grok Parsing: For custom log formats, Grok patterns allow you to extract specific fields using regular expressions. For example, if your logs include transaction IDs like
TXN-12345-ABC, you can create a Grok pattern likeTXN-%{NUMBER:transaction_id}-%{WORD:transaction_type}. This splits the numeric ID and alphabetic type into separate searchable fields. - JSON Parsing: If your applications produce JSON-formatted logs, Datadog can automatically recognize and convert each key-value pair into searchable attributes.
You can test your parsing rules using Datadog's Log Explorer preview feature. This helps identify any errors before applying the rules to production pipelines.
Adding Context with Enrichment Methods
After parsing, enrich your logs with additional context using reference data and custom processors.
-
Reference Tables: Add business context by uploading CSV files containing information like customer details, product catalogs, or error descriptions. Datadog's Lookup Processor matches values from your logs with these tables, appending relevant data as new attributes.
For datasets that change frequently, link your Reference Tables to cloud storage like Amazon S3 or Azure Storage. These linked tables, supporting up to 200MB of data, update automatically when the source files are modified.For instance, if your logs include merchant IDs, you can link them to a
Merchant_DetailsReference Table containing merchant names and contact information. When a log with a merchant ID is processed, Datadog adds this business data automatically, making it easier to troubleshoot issues tied to specific merchants or accounts. -
Built-in Processors: These simplify common enrichment tasks:
- Add Hostname Processor: Includes server names in all log entries.
- Add Environment Variables Processor: Adds configuration details to differentiate between environments like development, staging, and production.
- String Builder Processors: Combine log fields with static text to create custom attributes. Use this to generate readable descriptions, build unique identifiers, or format data for other systems.
- Tags Processors: Apply consistent labels to your logs, enabling better filtering and grouping in dashboards and alerts. Tags can reflect service names, deployment environments, regions, or business units.
Security teams can also use Reference Tables to flag potential threats. For example, by maintaining a table of known malicious IP addresses or suspicious user agents, Lookup Processors can automatically identify and highlight risky activity. This streamlines security investigations and helps prioritize responses.
Best Practices for Log Enrichment
Once you've set up log ingestion and enrichment, following best practices can make ongoing log management smoother and more efficient. A well-thought-out approach to log enrichment ensures you get the most out of your setup while steering clear of common mistakes.
Consistent Naming Conventions
Using standard naming conventions transforms messy logs into well-organized, easily searchable data. Datadog's common schema is a great tool for this, as it helps standardize attribute names across different technologies.
The schema employs logical prefixes to group attributes, making it simpler to filter and locate specific information. For example, network-related data uses the network prefix, HTTP request details use http, and database operations use db. This structure eliminates confusion when dealing with a variety of log sources.
Datadog's common schema simplifies logs by unifying attributes like
client.ip(from ELB logs) andremote_addr(from NGINX logs) into a single, standardized attribute:network.client.ip.
Similarly, HTTP status codes from servers like NGINX or HAProxy are standardized as http.status_code. This consistency means you can create dashboards and alerts that work seamlessly across your infrastructure, regardless of the source.
For custom applications or internal systems, you can expand this methodology by defining your own attributes in Datadog's Standard Attributes configuration tab. When setting up custom attributes, be sure to include details like the naming convention, attribute type (e.g., string or integer), and mappings to align existing attributes with your new standards.
Database operations also benefit from this uniformity. Whether you're working with MySQL, Cassandra, or MongoDB, all database-related operations can be mapped to a single attribute: db.statement. This makes it much easier to monitor database performance consistently across different technologies.
Up next, explore how to monitor and optimize your enriched logs for the best results.
Monitoring and Validating Enriched Logs
Once you've set up your pipelines and parsing rules, it's crucial to ensure your enriched logs are working as intended. This section explains how to monitor and validate your enriched logs effectively. Datadog's Log Explorer is your go-to tool for checking that enrichment rules are applied correctly and that your logs now include the added context you need.
Validating Enrichment in Log Explorer
The Log Explorer makes it easy to evaluate the results of your enrichment efforts. Start by searching for logs that should reflect your enrichment rules. When you find these logs, open the side panel to examine the enriched attributes.
Look for the expected enriched fields, such as user.fullname, and confirm they appear as intended. The side panel lists all attributes for each log entry, which helps you quickly spot any missing or improperly formatted data.
You can also use Calculated Fields to test enrichment logic in real time. These fields let you perform quick transformations directly in the Log Explorer without waiting for pipeline updates. For example, an SRE investigating slowdowns on an e-commerce platform used the @end_time and @start_time attributes to define a Calculated Field with the formula @end_time - @start_time, creating a new #DURATION field to identify performance bottlenecks instantly.
For attributes created during ingestion-time enrichment using Pipelines and Processors, consider adding facets to these new fields. Facets allow you to filter, group, and analyze logs based on enriched data, ensuring the enrichment is functioning correctly and the data is indexed for efficient searching.
If you notice missing or incorrect fields, it’s time to troubleshoot potential parsing issues.
Troubleshooting Common Issues
When something doesn't look right during validation, try these troubleshooting steps:
- Grok Parser Errors: If enrichment isn’t working, check that your Grok patterns match the sample log entries. Errors here can block enrichment entirely.
- Missing Source Attributes: If an enrichment rule depends on a field like
@request_idbut the upstream parser doesn’t extract it, enrichment might silently fail. Use the Log Explorer to trace the pipeline and locate the problem. - Data Type Mismatches: If an enrichment rule expects a number but gets a string, the operation could fail or lead to incorrect results. Double-check your Remapper configurations to confirm that attributes have the right data types before enrichment.
- Performance Issues: Overly complex enrichment rules or high log volumes can slow down processing. Check pipeline metrics in Datadog to find bottlenecks. If specific processors show high processing times, simplify the logic or break it into smaller steps.
Once you’ve addressed any issues, keep an eye on enrichment performance using dashboards and alerts.
Setting Alerts and Dashboards for Enrichment Performance
Dashboards tailored to enrichment performance are essential for ongoing monitoring. Track metrics like the percentage of successfully enriched logs, latency at each pipeline stage, and error rates for individual processors. These visualizations can help you spot trends and detect when enrichment quality begins to drop.
Set up alerts for critical enrichment failures. For example, you can configure notifications to trigger if a large number of logs are missing expected enriched fields, signaling potential parsing problems that need attention.
Monitor pipeline throughput to avoid delays. High log volumes can overwhelm complex enrichment rules, leading to slow processing or dropped logs. Alerts can notify you when processing times exceed acceptable thresholds based on your baseline metrics.
To measure enrichment success over time, create custom log-based metrics that compare the number of successfully enriched logs to the total logs processed. This data is invaluable for evaluating the effectiveness of your enrichment strategy and identifying areas for improvement.
Security teams can also gain value by monitoring the enrichment of sensitive data fields. Set alerts to flag cases where logs containing sensitive information aren’t enriched properly or where rules fail to apply the necessary classifications.
For example, an analyst working with ad server logs used Calculated Fields to combine
@firstNameand@lastNameinto a#fullNamefield. This enabled quick grouping and analysis by user, demonstrating how query-time enrichment can speed up investigations.
Key Takeaways for SMBs
Using Datadog for log enrichment can turn raw log data into insights that drive smarter decisions. By adding context to your logs, you can cut troubleshooting time from hours to minutes and uncover critical details about user behavior, system performance, and potential security issues.
Start by focusing on your most important log sources. Prioritize data that directly impacts key areas like session tracking, payment processing, or API performance. Once you have a solid foundation, you can gradually expand your enrichment efforts.
Keep in mind that log enrichment isn't a one-and-done task - it requires regular updates. As your applications evolve, your parsing rules and enrichment processors will need adjustments. Use Datadog's tools to set up dashboards and alerts that monitor how well your enrichment strategy is working. This ensures your efforts continue to deliver results as your business grows.
For SMBs with limited resources, validation is especially important. Datadog's Calculated Fields can help you quickly test and fine-tune your enrichment logic. This approach allows you to iterate faster and catch potential issues early, preventing them from affecting your monitoring setup.
As your log volume increases, keeping costs under control becomes a priority. Following best practices for managing sensitive data and optimizing performance can help you get the most out of your logs without overspending. Strategic sampling and filtering are particularly effective for reducing ingestion costs while still preserving the insights you need. These methods not only save money but also set the stage for scalable, efficient monitoring.
For SMBs aiming to scale their use of Datadog, the techniques outlined in this guide offer a strong starting point for advanced monitoring. Enriched logs unlock more precise alerting, better root cause analysis, and a deeper understanding of how your systems behave under various conditions. With a well-thought-out log enrichment strategy, your team can respond to incidents faster and make smarter decisions as your infrastructure becomes more complex. Enriched logs can become a competitive edge, helping you act quickly and base decisions on real, actionable data.
FAQs
How can I make sure my log enrichment setup in Datadog is secure and follows best practices?
To maintain a secure and efficient log enrichment setup, start by using role-based access control (RBAC). This ensures that only authorized users can access sensitive data, reducing the chances of unauthorized changes or data exposure.
Take advantage of Datadog’s built-in tools designed to safeguard sensitive information. Features like data masking and leak prevention can help protect your logs. It's also a good idea to regularly review your configurations to ensure they align with security standards and keep your data safe.
These practices can help you strengthen both the security and compliance of your log enrichment process in Datadog.
How can Datadog's log enrichment benefit small and medium-sized businesses (SMBs)?
Datadog's log enrichment transforms raw logs into structured, readable formats while adding meaningful context. This process makes it easier for small and medium-sized businesses (SMBs) to analyze logs, spot issues, and monitor their systems more effectively.
By using enriched logs, SMBs can gain clearer insights into their infrastructure, resolve problems faster, and handle incidents more efficiently. This approach not only improves system performance but also helps cut costs by simplifying log management and optimizing resource usage.
What steps can I take to troubleshoot common issues with log enrichment in Datadog?
If you're running into trouble with log enrichment in Datadog, start by verifying the Datadog Agent's status to make sure it's functioning properly. Then, check that outbound traffic on port 10516 isn't being blocked by your network or firewall settings. It's also important to review your permissions and configuration files, especially those related to enrichment table processors, to confirm everything is correctly set up.
If the issue continues, try restarting the Agent to reset its processes. Additionally, ensure your network connectivity is stable and recheck all configuration details for accuracy. These steps often address common log enrichment issues and help keep your setup running smoothly.

