
Serverless Workflow Integration with Datadog
Learn how to effectively monitor serverless workflows with comprehensive insights, custom metrics, and cost management strategies.
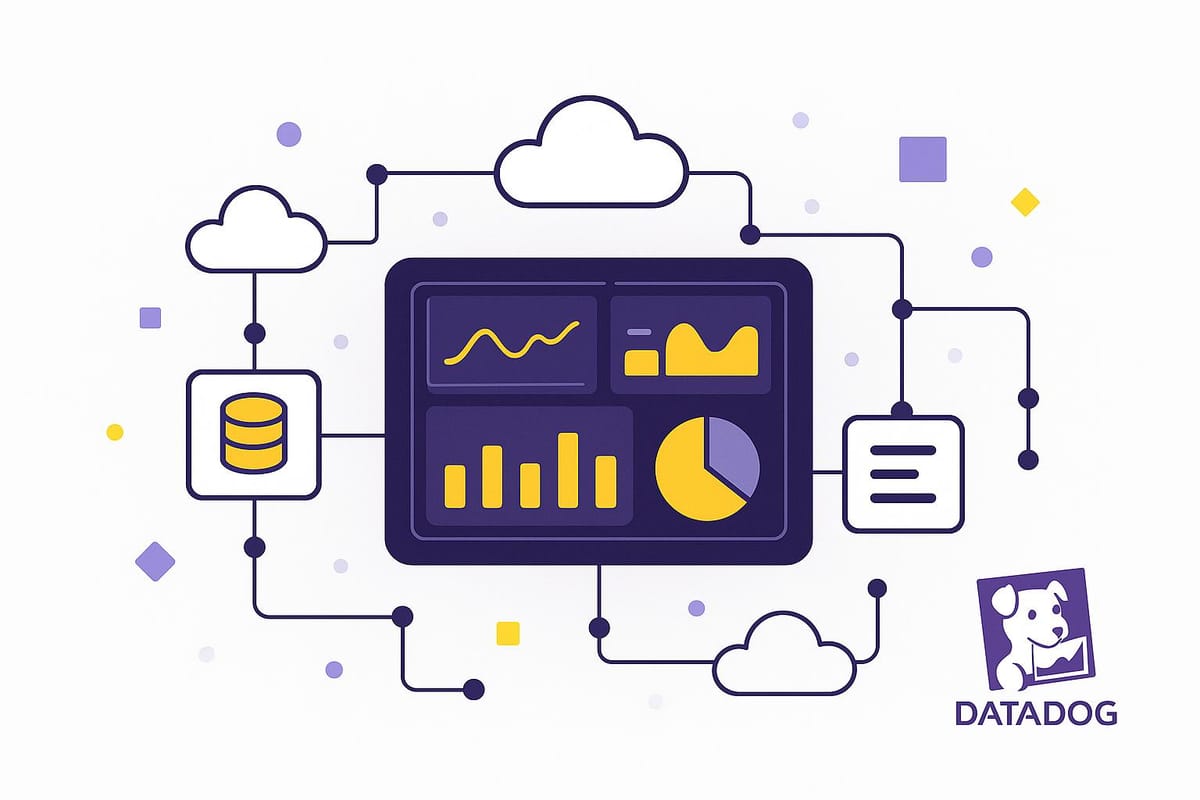
Serverless computing helps businesses save on costs, scale automatically, and develop faster by removing the need to manage servers. But monitoring serverless environments is tricky because functions execute in milliseconds, and applications span multiple cloud services. Datadog solves this by offering:
- Complete visibility: Monitor metrics, logs, and traces across AWS Lambda, Azure Functions, and Google Cloud Functions.
- Faster troubleshooting: Reduce detection and resolution times with detailed insights into performance issues.
- Cost management: Track usage and control serverless spending with tools like log retention filters and usage attribution.
Quick Benefits:
- Track custom metrics like user actions or purchases without redeploying code.
- Use distributed tracing to monitor how requests flow through serverless systems.
- Optimize performance by identifying cold start issues or resource bottlenecks.
- Manage costs with tools to reduce unnecessary logs and optimize resource usage.
Datadog simplifies serverless monitoring, helping businesses focus on building impactful applications while keeping costs and performance in check.
AWS Lambda Observability with Datadog - Implementation Guide
Setting Up Datadog for Serverless Environments
To tackle the challenges of monitoring serverless platforms, it's essential to configure Datadog for each environment - whether you're using AWS, Azure, or GCP. Here's how to set up Datadog for your serverless infrastructure.
Integrating Datadog with AWS Lambda
To monitor AWS Lambda effectively, you'll need to integrate three key components: the AWS integration, the Lambda Library, and the Lambda extension. Together, these provide access to detailed metrics, tracing, and logs.
Start by setting up the AWS integration. Create an IAM role with read-only access to AWS Lambda and related services. Then, add your AWS account details and the IAM role name in Datadog, making sure to select "Lambda" during the configuration process.
Next, install the Lambda Library in your runtime. Add the Lambda extension as a Layer using the appropriate Amazon Resource Name (ARN). The extension supports multiple runtimes, including Node.js, Python, Java, Go, and .NET (currently in beta). It transmits data to Datadog efficiently, ensuring your function's performance remains unaffected.
Finally, adjust your function's environment variables. Add your Datadog API key and set DD_LOGS_ENABLED to true to enable log collection.
Monitoring Azure Functions with Datadog
Azure Functions can be monitored using the Datadog App Service extension, which provides detailed performance metrics and trace data. Since Azure Functions operate on the Azure App Service platform, this extension enables full request tracing, linking trace data with metrics and logs across your Azure resources.
To get started, head to your Function App settings in the Azure portal and install the Datadog App Service extension. Once installed, the extension automatically collects metrics, traces, and logs from your Azure Functions.
Be aware of a specific issue affecting Node.js Azure Functions as of August 2024, where JSON logs may escape certain characters. To address this, update your log forwarder to handle escaped characters properly (e.g., return obj.replace(/\\'/g, "'");), adjust the host.json settings, or use a custom logger.
Configuring GCP Cloud Functions for Monitoring
Monitoring GCP Cloud Functions with Datadog requires a few setup steps. First, create a service account with the following roles: Monitoring Viewer, Compute Viewer, Cloud Asset Viewer, and Browser. Additionally, assign the Service Account Token Creator role to the Datadog principal.
Once your service account is ready, add its email address in Datadog and verify the connection.
Next, create a log sink to route Cloud Functions logs to a Pub/Sub topic. Use the Pub/Sub-to-Datadog Dataflow template to export logs in real time. This setup ensures that both Cloud Functions and Cloud Run jobs are automatically displayed in your Datadog dashboards.
Adding Custom Metrics and Tracing to Serverless Workflows
Once your serverless workflows are up and running, the next step is to gather actionable insights. With custom metrics and distributed tracing, you can gain the visibility needed to understand how your applications perform and how they influence your business outcomes.
Creating Custom Metrics
Custom metrics allow you to monitor data points that go beyond standard infrastructure stats. Think of tracking user actions like customer logins, video plays, or purchases alongside traditional metrics like CPU and memory usage. With Datadog, you can generate these custom metrics without needing to redeploy your code, making it easier to collect valuable insights.
For example, let’s say a coffee shop wants to track order values. Using Python and the Datadog Lambda extension, they could implement the following:
from datadog_lambda.metric import lambda_metric

def lambda_handler(event, context):
    lambda_metric(
        "coffee_house.order_value",             # Metric name
        12.45,                                  # Metric value (in USD)
        tags=['product:latte', 'order:online']   # Associated tags
    )
This snippet sends a custom metric named coffee_house.order_value with a value of $12.45, along with tags to identify the product and order type. The Lambda extension automatically aggregates these metrics into distributions, making it easy to visualize averages, sums, counts, and even percentiles. You can also link custom metrics to traces, helping you track patterns like error rates or latency spikes. Once the data flows into Datadog, you can set up monitors to catch potential issues early and build dashboards, alerts, and Service Level Objectives (SLOs) tailored to your business goals.
Setting Up Distributed Tracing Across Workflows
Distributed tracing gives you a complete view of how requests travel through your serverless architecture. With Datadog APM, you can track performance at the function level and gain detailed insights into usage patterns.
To enable tracing, ensure you're using the latest version of Datadog’s Lambda extension. Then, use the Datadog CLI to instrument your Lambda functions. This approach updates configurations without requiring a full redeployment, saving time and reducing risk. Add your Datadog API key to each Lambda’s environment variables under the key DD_API_KEY. To simplify things further, wrap your function with Datadog’s tracing utility, which automatically generates spans. Datadog supports multiple programming languages - like Java, Python, Ruby, Go, Node.js, .NET, and PHP - and offers trace merging features to combine AWS X-Ray traces with Datadog APM data. This integration provides a complete picture, even when working with managed services like AWS AppSync or Step Functions .
This level of technical insight helps you monitor workflows and connect them to broader business metrics.
Tracking Business Metrics for Decision-Making
Datadog doesn’t just track technical metrics - it also captures business-focused data that can inform strategic decisions. For instance, you can monitor metrics like processed purchases, user check-ins, or ad impressions. By correlating this data with infrastructure metrics, you can identify when issues like increased latency or error rates are affecting your bottom line.
Datadog collects business metrics from various sources, including backend application code, Real User Monitoring (RUM), and third-party systems via data ingestion APIs. These insights allow you to set up alerts for potential issues, while machine learning-based anomaly detection highlights unusual patterns in usage or performance.
Greg Shackles, VP of Technology at Olo, shared how this approach benefits his team:
"We have our customer success engineers, our VP of Finance, our CEO, all using Datadog as a visualization tool for just how close we are to accomplishing some important goal as a company. Be it orders going through our system, or users signing up for accounts, it really helps bring together an entire company behind a goal that we have, and visualize progress toward it."
Improving and Scaling Serverless Workflows with Datadog
Once you’ve established a solid monitoring setup with custom metrics and tracing, the next step is tackling common serverless challenges. With Datadog, you can address issues like cold starts, managing costs, and scaling resources effectively.
Reducing Cold Start Issues
Cold starts can seriously impact performance. For instance, Java functions often take nearly three times longer to initialize compared to Python functions. With Datadog’s Cold Start Tracing, you can pinpoint the root causes of these delays. This tool visualizes dependencies loaded during a cold start as spans on a flame graph, making it easier to identify which processes are slowing things down. For example, importing duplicate AWS SDK versions can add roughly 400 milliseconds to startup times.
To minimize cold start delays, consider these strategies:
- Remove redundant dependencies.
- Use lazy loading to defer loading modules until they’re needed.
- Narrow the scope of your modules.
- Adjust Lambda function settings, such as increasing memory allocation or enabling provisioned concurrency.
For Java applications, AWS Lambda SnapStart offers a significant boost, improving startup performance by up to 10x for latency-sensitive workloads.
Managing Costs with Monitoring
Serverless costs can escalate quickly if left unchecked. Datadog’s usage attribution feature helps track spending and uncover opportunities for optimization. With Datadog charging $0.50 per million invocations for Serverless Monitoring, keeping a close eye on costs is vital for high-traffic applications. By implementing formal monitoring governance, organizations have reported reducing Datadog expenses by 30–40%. Additionally, quarterly cost reviews can highlight 15–25% in potential savings.
Key cost-saving practices include:
- Applying log retention filters to discard low-value logs.
- Using exclusion filters for development and test logs.
- Implementing log sampling to reduce ingestion volumes.
Tim Ewald, CTO at Kevel, emphasizes the importance of viewing cost as a core metric:
"It's not about tradeoffs between cost and performance: cost is a need, just as important as scalability and security. CCM has empowered engineers in our organization to understand this and act on cost data in the same way they would on performance, to maintain efficiency as we scale."
Scaling and Resource Management
Scaling efficiently is critical for maintaining performance as your serverless applications grow. Datadog’s Serverless view provides a unified look at telemetry data from Lambda functions and AWS resources, helping you identify interactions and bottlenecks. You can group resources by service, stack, or custom tags to quickly diagnose scaling issues. For example, if API Gateway latency spikes, the Serverless view can reveal whether a connected Lambda function is being throttled.
With AWS serverless adoption increasing by 3% from 2022 to 2023 - and over 70% of Datadog’s AWS customers using at least one serverless solution - scaling strategies are more crucial than ever. Datadog APM offers a clear visualization of Lambda functions and the AWS resources they invoke, giving you insights into dependencies and potential scaling challenges.
For managing logs at scale, Datadog’s Logging without Limits™ lets you ingest all logs while deciding later which ones to index. This is particularly useful since log volumes can grow by 200–300% annually without proactive management. Use Log Patterns to identify noisy log types and apply exclusion filters to keep costs in check.
Key Takeaways
Combining serverless workflows with Datadog transforms how SMBs approach monitoring and optimization. Datadog provides full observability by collecting and analyzing metrics, logs, and traces, which helps minimize detection and response times.
Datadog also simplifies cost management and scalability for growing businesses. Its usage-based pricing model ensures predictable costs by charging based on actual usage - like invocations, containers, or pods - instead of a per-host fee. This approach allows businesses to better manage their budgets.
Beyond monitoring and cost control, Datadog strengthens workflow resilience and scalability, especially as serverless technologies gain traction. With enhanced Lambda metrics, Datadog delivers detailed insights with minimal delay. Plus, its capability to generate custom metrics from traces or logs - without requiring code redeployment - saves developers valuable time.
For SMBs aiming to optimize costs, here are some practical tips:
- Use log retention filters to drop logs with low value.
- Apply exclusion filters for development and test environments.
- Implement log sampling for high-volume services.
- Limit high-cardinality tags to avoid exponential growth in custom metrics.
Datadog's Logging without Limits™ feature is another game-changer, enabling you to ingest all logs while deciding later which ones to index.
Finally, Datadog's traceability tools connect serverless functions to your broader infrastructure. Features like deployment tracking and distributed tracing provide a detailed view of application performance, seamlessly linking serverless functions to the rest of your ecosystem. This integration allows SMBs to maintain resilient and cost-efficient serverless architectures.
FAQs
How does Datadog monitor serverless environments without slowing them down?
Datadog offers real-time insights into serverless applications without compromising performance. By gathering metrics, traces, and logs from serverless components like AWS Lambda, it enables teams to swiftly identify and address issues, cutting down both mean time to detection (MTTD) and mean time to resolution (MTTR).
Designed to handle the ever-changing nature of serverless environments, Datadog automatically consolidates and examines data to provide actionable insights. This ensures your applications operate smoothly while maintaining comprehensive monitoring.
How can I set up custom metrics and distributed tracing for my serverless applications with Datadog?
To set up custom metrics for your serverless applications, start by adding the Datadog Lambda extension to your AWS Lambda functions. This extension allows you to send custom metrics straight to Datadog. Within your Lambda functions, use the datadog_lambda.metric library to define and send metrics - like tracking order totals or monitoring user interactions.
For distributed tracing, make sure your Lambda functions are written in a supported language, such as Python, Node.js, Ruby, Go, Java, or .NET. Incorporate the Datadog tracing library into your functions to capture traces and connect them with your metrics. This approach gives you a clear, end-to-end view of your application's performance, making it easier to pinpoint bottlenecks and streamline processes.
By integrating custom metrics with distributed tracing, you’ll have the tools to keep a close eye on your serverless applications and uncover valuable insights into how they operate.
How does Datadog help manage serverless costs, and what are the best practices for keeping expenses under control?
Datadog makes managing serverless costs easier by offering real-time insights into cloud spending. With features like Cloud Cost Management, you can break down billing data, monitor expenses by service, and design custom dashboards to pinpoint what’s driving costs. These tools empower teams to stay on top of their budgets and make smarter decisions to optimize spending.
To keep costs under control, you can set up automated alerts for unexpected spending spikes and use anomaly detection to spot unusual patterns early. Datadog’s Continuous Profiler goes a step further by analyzing CPU and memory usage, helping you fine-tune auto-scaling policies and cut down on unnecessary resource consumption. By examining historical performance data, you can also refine scaling strategies, ensuring resources are allocated effectively and costs remain predictable.


