
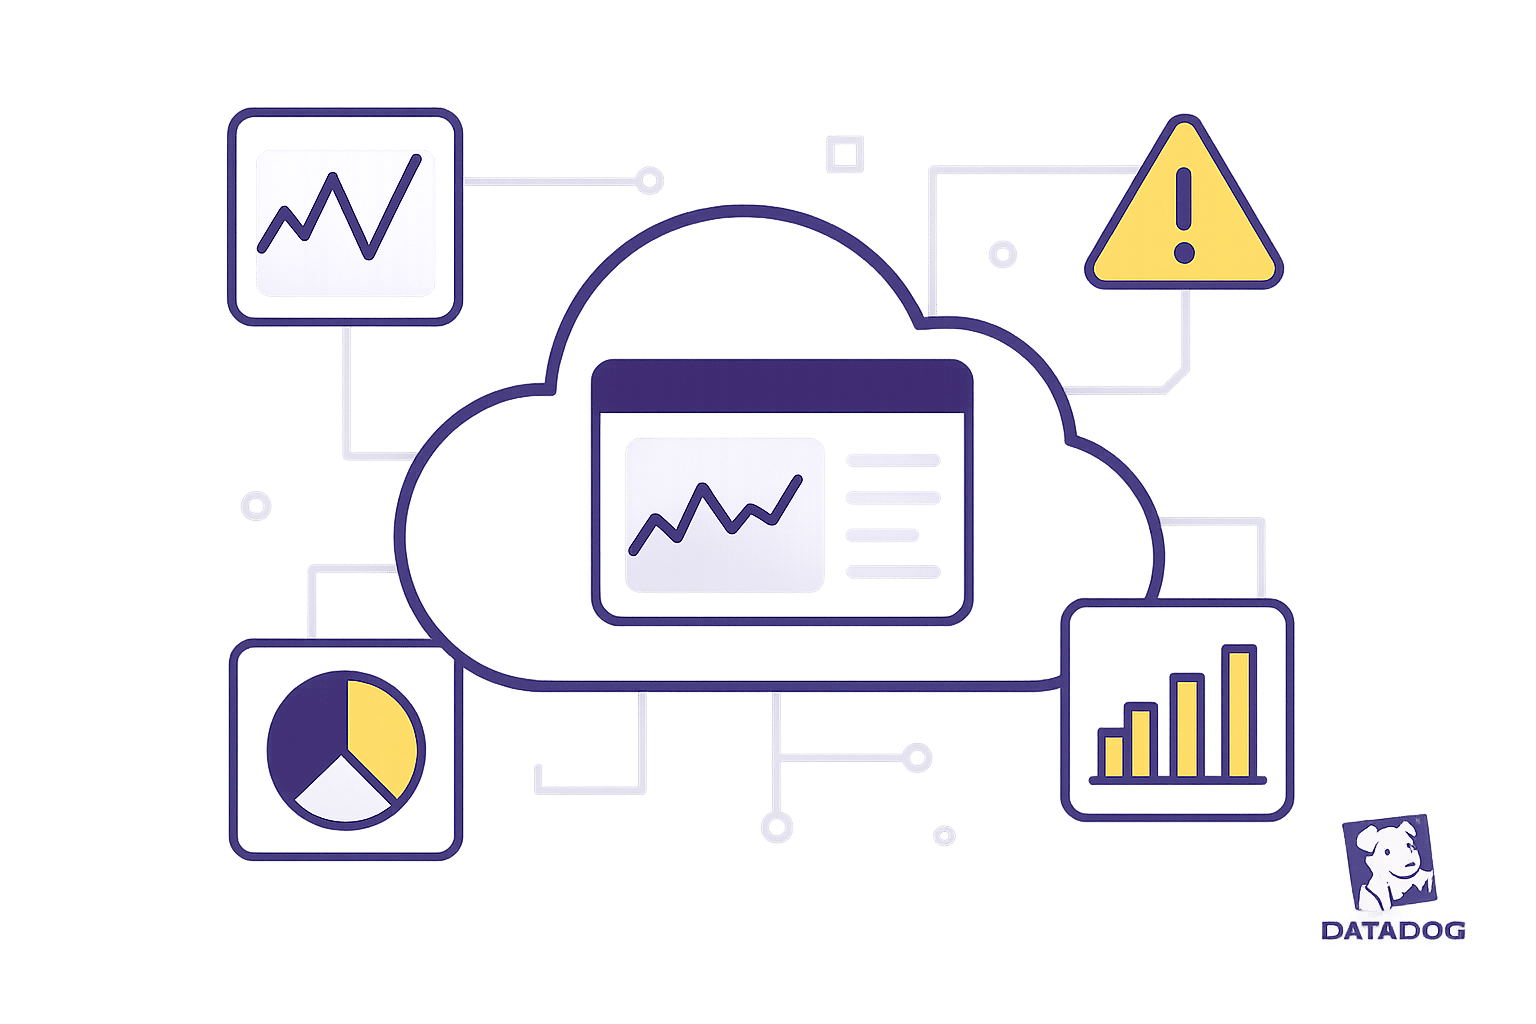
Top Metrics for Budget Alerts in Datadog
Learn essential metrics and strategies for managing cloud costs effectively with budget alerts in Datadog, ensuring performance and reliability.
Managing cloud costs can be overwhelming, but Datadog provides tools to monitor and control your spending effectively. Here's a quick breakdown of the key metrics and strategies to set up budget alerts and optimize costs:
- Host Count Monitoring: Track infrastructure usage and set alerts at 80% and 90% of your host budget to prevent overspending.
- Log Volume Management: Use filtering, retention policies, and dynamic sampling to reduce log storage costs by 30–50%.
- APM Usage Tracking: Optimize trace sampling rates and monitor metrics like trace volume and span count to manage performance monitoring costs.
- Custom Metrics Usage: Focus on high-value metrics and implement governance to avoid unnecessary spending.
- RUM Session Tracking: Control session sampling rates and filter out low-value data to manage Real User Monitoring costs.
- Synthetic Test Usage: Optimize test frequency and consolidate tests to balance performance insights with budget limits.
- Cloud Cost Changes: Monitor daily and monthly spending trends, service-specific costs, and environment-specific expenses.
- Error Budget Tracking: Align reliability with cost management by tracking SLO performance and burn rates.
- Container Usage Metrics: Use alerts for CPU, memory, and storage thresholds to optimize container resource allocation.
- Reserved Instance Usage: Track utilization and coverage rates to maximize savings and minimize on-demand spillover.
Key Cost-Saving Strategies:
- Set up tiered alerts for early warnings on budget thresholds.
- Use tagging to categorize resources by team, environment, or application.
- Create dashboards to monitor trends, usage patterns, and cost breakdowns.
- Automate controls like scaling policies and dynamic test scheduling.
These steps can help you maintain visibility, control cloud costs, and avoid budget overruns while ensuring performance and reliability.
How Complyt used Datadog’s Cloud Cost Management to reduce their cloud spend

1. Host Count Monitoring
Keeping an eye on host counts in Datadog is essential for managing budgets effectively. By setting up alerts at specific thresholds, you can take action before costs spiral out of control.
| Alert Type | Threshold | Action |
|---|---|---|
| Warning | 80% of host budget | Review development or staging hosts |
| Critical | 90% of host budget | Conduct an immediate review of all environments |
| Forecast | Exceeds threshold in 14 days | Prepare for budget adjustments or reduce host usage |
To go beyond just monitoring, fine-tune your cost management with a well-thought-out tagging strategy.
Tagging for Cost Control
Use tags to categorize and analyze your infrastructure more effectively. Some useful tags include:
- Environment: prod, dev, staging
- Team owner: Assign responsibility
- Project/Application: Identify specific workloads
- Cloud provider: AWS, Azure, GCP, etc.
- Region: Pinpoint geographic usage
Dashboards are another key tool for tracking host counts. Set up views to monitor total active hosts, monthly growth trends, usage by environment, and team-specific utilization. For U.S.-based operations, ensure proper configurations:
- Display costs in USD (using the $ symbol)
- Use MM/DD/YYYY for dates
- Format numbers with commas and decimals (e.g., 1,000.00)
Organizations that monitor both billable and non-billable hosts can typically cut infrastructure expenses by 15-25%. On the flip side, failing to address excess hosts can lead to cloud costs increasing by 20-30%.
Up next, we’ll dive into additional metrics that can help you optimize cost management even further.
2. Log Volume Management
Managing log volume is a crucial aspect of controlling costs. By streamlining log management, you can maintain system visibility while keeping expenses in check.
Setting Up Budget Alerts
To avoid unexpected cost overruns, establish budget alerts at critical thresholds:
| Alert Level | Threshold | Action Required |
|---|---|---|
| Warning | 50% of budget | Review log sources and refine filtering rules |
| Critical | 75% of budget | Take immediate steps to reduce log volume |
Log Retention Strategy
A tiered retention policy ensures logs are stored efficiently based on their purpose:
| Log Type | Retention Period | Purpose |
|---|---|---|
| Security/Compliance | 1-3 years | Meet regulatory requirements |
| Application Errors | 30-90 days | Investigate and resolve issues |
| Performance Metrics | 7-30 days | Analyze trends |
| Debug Logs | 1-7 days | Support development efforts |
Cost Optimization Techniques
Smart log management can lead to substantial cost savings. By applying effective filtering and exclusion rules, organizations often cut log management expenses by 30-50%. For example, excluding high-volume, low-value logs can reduce ingestion by as much as 40%.
Smart Indexing Strategy
Understand the cost implications of how logs are stored:
- Indexed Logs: Around $0.10+ per GB, ideal for active troubleshooting.
- Archived Logs: Between $0.02 and $0.05 per GB, suitable for compliance and historical analysis.
- Rehydration Cost: $0.03 per GB to access archived logs.
Volume Control Best Practices
- Dynamic Sampling: Adjust sampling rates during traffic spikes to manage costs without losing critical data.
- Filtering: Use custom dashboards to monitor log volume by service, environment, and status on a monthly basis.
- Tagging: Apply consistent tags to track log volumes across various dimensions like:
- Business units
- Environments (e.g., production, staging, development)
- Application features
- Cost centers
Monitor Trends
Set up log-based monitors to identify unusual patterns in log generation. These patterns can signal application issues or serve as early indicators of rising costs. This proactive monitoring not only helps maintain system health but also ensures budgets stay under control.
Next, we’ll dive into metrics that enhance Datadog’s cost-management capabilities.
3. APM Usage Tracking
Keeping an eye on Datadog's performance insights is crucial for managing costs without losing visibility. This approach builds on earlier metrics, creating a consistent framework for cost management.
Key APM Metrics to Monitor
Here are the main APM metrics to track:
- Trace Volume: The total number of traces ingested during a specific time frame.
- Span Count: Represents the complexity of traces by counting spans.
- APM Host Count: Tracks the number of hosts submitting APM data.
- Service Count: Reflects the range of services being monitored.
Smart Sampling
Smart sampling helps control APM costs while preserving critical performance data. Tailor sampling rates to different environments:
| Environment | Sampling Rate | Retention Focus |
|---|---|---|
| Production | ~50% | Retain all errors and high-latency traces |
| Staging | ~25% | Keep traces relevant for performance testing |
| Development | ~10% | Capture only essential debug traces |
Adjust these rates based on your operational needs.
Filtering and Cost Control
To manage costs effectively, focus on retaining high-value data:
- Always Retain: Error traces (status codes ≥ 400), important customer journeys, and high-latency transactions.
- Consider Filtering Out: Health check endpoints, static asset requests, and background job traces.
Usage Monitoring Dashboard
Expand on earlier budget alerts by creating a centralized dashboard for APM tracking:
- Budget Tracking: Compare your current usage against the allocated budget.
- Service Analysis: Pinpoint which services generate the most traces.
- Cost Attribution: Break down usage by team or department for better accountability.
- Trend Analysis: Observe week-over-week or month-over-month changes in APM activity.
Dynamic Alert Configuration
Set up alerts to stay ahead of budget issues:
| Alert Level | Threshold | Suggested Action |
|---|---|---|
| Warning | 70% of budget | Review and tweak sampling rates |
| Urgent | 85% of budget | Refine filtering rules |
| Critical | 95% of budget | Take immediate steps to reduce usage |
Retention Strategy
Optimize your trace retention by aligning storage duration with business importance. Retain error traces and high-value data for longer periods, while reducing retention for routine traces.
4. Custom Metrics Usage
Expanding on earlier monitoring strategies, custom metrics provide tailored insights that align closely with your business needs. However, these metrics can quickly drive up Datadog costs if not managed carefully. Keeping a close eye on custom metrics is essential to avoid unnecessary budget strain.
Metric Selection Strategy
Focus on metrics that directly impact your business goals. Here’s a way to categorize them effectively:
| Category | Example Metrics |
|---|---|
| Business Critical | Visitor count, Basket size, Conversion rates |
| Performance | API response times, Latency, Error rates |
| System Health | CPU usage, Memory utilization |
| Development | Build times, Test coverage, Deployment frequency |
By concentrating on these categories, you can ensure your monitoring efforts stay relevant and actionable.
Structured Governance for Metrics
To avoid metric overload and maintain alignment with your objectives, a structured governance framework is essential. Here's how to approach it:
| Focus Area | Best Practice | Business Impact |
|---|---|---|
| Metric Selection | Prioritize KPIs like visitor count and latency | Links monitoring directly to business performance |
| Cost Management | Use strategic tagging and schedule regular reviews | Keeps costs manageable and avoids waste |
| Governance | Conduct quarterly reviews and assign metric ownership | Ensures monitoring remains efficient and sustainable |
This governance framework not only keeps your metrics organized but also paves the way for automated controls to further safeguard costs.
Automated Budget Controls
Set up automated alerts to notify you when usage approaches budget limits. For non-critical metrics, configure actions to pause or adjust them automatically, ensuring your spending stays within bounds.
Best Practices for Cost Management
- Use consistent tagging to clarify metric ownership and purpose.
- Regularly review metrics to identify and eliminate redundancies.
- Maintain a centralized registry of custom metrics, including their business relevance.
5. RUM Session Tracking
Real User Monitoring (RUM) session costs can have a big impact on your Datadog budget. Keeping a close eye on these metrics is essential for managing costs effectively while ensuring you maintain a clear picture of the user experience.
Accurate tracking of RUM sessions not only keeps your spending under control but also helps optimize performance.
Session Budget Management
Use a tiered alert system to track your RUM session usage and avoid budget overruns:
| Alert Level | Budget Threshold | Recommended Actions |
|---|---|---|
| Warning | 70% | Analyze usage patterns and adjust sampling rates |
| Critical | 85% | Implement session filtering and sampling immediately |
| Emergency | 95% | Activate emergency cost controls and notify stakeholders |
Strategic Session Monitoring
Customize your monitoring approach and data retention policies based on the importance of the environment:
| Environment Type | Monitoring Level | Session Retention |
|---|---|---|
| Production (Critical Paths) | 100% | 15 days |
| Production (Standard Flows) | 50–75% | 15 days |
| Staging | 25% | 7 days |
| Development | 10% | 3 days |
Cost Optimization Techniques
To get the most out of your RUM budget, focus on high-impact monitoring:
-
Session Filtering
Narrow down monitoring to critical user journeys that matter most for your business. -
Geographic Distribution
Keep an eye on session activity by region to prioritize monitoring in key areas. -
Custom Event Optimization
Track only essential events to stay focused on high-value user interactions.
Automated Controls
Leverage automation to keep tabs on your RUM session usage and stay within budget. Set up dashboards to display:
- Daily session counts compared to your monthly budget
- Weekly trends in session usage
- The percentage of the budget consumed relative to the time elapsed in the month
Prevention Strategies
Unexpected spikes in RUM sessions can quickly eat into your budget. Stay ahead by addressing these common culprits:
| Source | Impact | Prevention Measure |
|---|---|---|
| Traffic Surges | Rapid budget depletion | Use dynamic sampling rates |
| Bot Traffic | Unnecessary session creation | Enable bot detection filters |
| SPA Misconfiguration | Multiple session counts | Review and fix tracking code |
| Development Testing | Wasted budget | Enforce strict caps for test environments |
6. Synthetic Test Usage
Synthetic tests in Datadog simulate real user interactions with your applications, making them a crucial tool for assessing performance. However, these tests come with variable costs, which depend on their frequency and complexity. Keeping a close eye on synthetic test usage is essential to balance performance insights with budget considerations.
Test Cost Structure
Different types of synthetic tests have varying cost implications:
| Test Type | Cost per 1,000 Runs | Annual Cost (5-min Interval) | Annual Cost (1-min Interval) |
|---|---|---|---|
| Browser Test | $7.20 | $2,074 | $10,368 |
| API Test | $3.60 | $1,037 | $5,184 |
| Multi-step API | Varies by steps | Varies by steps | Varies by steps |
Budget Alert Configuration
To avoid overspending, set up a tiered alert system to monitor test usage:
| Alert Level | Budget Threshold | Suggested Actions |
|---|---|---|
| Warning | 70% | Review test frequencies and eliminate redundant checks. |
| Critical | 85% | Reduce the frequency of non-essential tests temporarily. |
| Emergency | 95% | Pause low-priority tests and notify budget stakeholders. |
Test Optimization Strategies
You can optimize synthetic tests by focusing on critical areas and reducing unnecessary usage:
- Test Frequency Management: Prioritize frequent checks for essential user journeys while scaling back on secondary features or during off-peak hours.
- Location Optimization: Run tests only from key locations that align with your target audience to minimize costs without sacrificing relevance.
- Test Consolidation: Combine related single-step tests into multi-step sequences to cut down on the number of test executions. Use tagging to monitor usage by business unit or application effectively.
These strategies can help streamline testing while staying within budget.
Usage Monitoring Dashboard
Create a centralized dashboard to keep track of synthetic test usage. Key metrics to include:
- Daily Test Count: Breakdown by test type to monitor execution trends.
- Failure Rates: Identify tests that might be wasting resources due to frequent errors.
- Budget Trends: Compare test execution patterns against your allocated budget.
- Cost Distribution: Track expenses by team or application for better accountability.
This kind of dashboard provides clear insights into usage patterns and helps identify areas for improvement.
Automated Controls
Implement automated controls to maintain cost efficiency without manual intervention:
- Dynamic Scheduling: Adjust test frequency based on traffic patterns.
- Caching Results: Cache responses for static endpoints to avoid redundant tests.
- Automatic Pausing: Temporarily disable tests that overlap or no longer provide value.
- Segmented Alerts: Send usage alerts by team or application to ensure accountability.
7. Cloud Cost Changes
Keeping a close eye on cloud cost fluctuations is essential for staying within budget. Tools like Datadog offer real-time cost visibility across your infrastructure, helping you manage expenses effectively. Let’s dive into the metrics, alerts, and automation techniques that can help you stay in control of your cloud spending.
Cost Monitoring Metrics
To manage costs efficiently, focus on these key metrics:
| Metric Type | Alert Threshold | Required Action |
|---|---|---|
| Daily Spend | +20% week-over-week | Investigate resource scaling events |
| Monthly Forecast | 85% of budget | Review and adjust resource allocation |
| Service-specific Costs | +30% month-over-month | Analyze service usage patterns |
| Environment Costs | Custom threshold per env | Compare staging vs. production spend |
Tracking these metrics ensures you can act quickly when costs begin to rise unexpectedly.
Alert Configuration Strategy
Setting up tiered alerts is a smart way to monitor and manage cloud spending. Here’s how you can structure your alerts:
Infrastructure-wide Metrics:
- Total cloud spend across all services
- Month-to-date spending compared to budget
- Projected end-of-month costs
- Cost breakdown by environment (e.g., production, staging, development)
Service-specific Metrics:
- Compute resource usage and associated costs
- Storage growth and retention expenses
- Network transfer charges
- Database instance costs
These alerts work seamlessly with your broader monitoring strategy, helping you identify and address overspending before it becomes a problem.
Automated Cost Control
Using these metrics, you can automate cost controls to respond quickly to spending changes. Leverage historical spending data to set dynamic thresholds and fine-tune alert sensitivity. For critical cost spikes, configure automatic escalations to ensure immediate action.
Cost Optimization Dashboard
A well-designed dashboard can provide a clear snapshot of your cloud costs. Here’s what to include:
| Dashboard Component | Purpose | Update Frequency |
|---|---|---|
| Spend Overview | Total cloud costs and budget status | Real-time |
| Service Breakdown | Cost distribution by service | Daily |
| Usage Trends | Historical spending patterns | Weekly |
| Budget Forecasting | Projected costs and variances | Monthly |
This dashboard keeps all stakeholders informed and enables proactive cost management.
Integration Setup
To maximize visibility and control, enable detailed billing ingestion, set up custom cost center metrics, and use resource tagging for granular tracking.
Automated Reporting:
- Schedule regular cost reports
- Notify stakeholders of spending updates
- Export data to business intelligence tools for deeper analysis
With these strategies in place, you’ll have a solid foundation for managing cloud costs. Up next, we’ll explore how real-time usage monitoring can further enhance your budget management efforts.
8. Error Budget Tracking
Error budget tracking takes your cost control efforts to the next level by helping you balance reliability and spending. It works alongside other Datadog cost metrics, offering a more complete strategy for financial oversight.
Error Budget Components
| Component | Threshold | Action Required |
|---|---|---|
| Monthly Error Budget | 99.9% SLO (43.2 minutes downtime) | Monitor baseline reliability |
| Warning Alert | 50% budget consumed | Review system performance |
| Critical Alert | 75% budget consumed | Apply fixes immediately |
| Burn Rate | 7-day budget/24 hours | Activate emergency measures |
Cost-Effective Monitoring Strategy
To get the most out of error budget tracking, configure alerts that focus on your most critical services. Align alert windows with your operational needs, such as setting a 30-day window for monthly reports and a 7-day window for weekly updates.
Tips for Configuring Alerts:
- Use progressive thresholds to reduce alert fatigue.
- Set up different notification channels based on the severity of the issue.
- Assign clear ownership for responding to alerts.
- Document standard procedures for handling recurring issues.
Budget Integration
Incorporate error budget metrics into your broader cost management efforts by tracking key factors such as:
- Costs related to SLO violations.
- Resource scaling events caused by reliability issues.
- Log volume spikes during incidents.
- Application Performance Monitoring (APM) usage during error budget breaches.
Optimization Techniques
Service-Level Monitoring:
- Tag services critical to your business.
- Track error budgets based on service tiers.
- Link reliability expenses to their impact on revenue.
Resource Management:
- Keep an eye on error budget consumption rates.
- Compare burn rates with infrastructure costs.
- Use historical data to plan for future capacity needs.
Dashboard Integration
To streamline monitoring, integrate these key metrics into a reliability cost dashboard:
| Metric | Purpose | Update Frequency |
|---|---|---|
| Error Budget Status | Shows current consumption level | Real-time |
| Cost Impact | Links infrastructure spending to reliability | Daily |
| Service Health | Tracks SLO performance by service | Hourly |
| Budget Forecast | Predicts future reliability costs | Weekly |
Bringing these metrics together on a single dashboard helps you maintain service levels without overspending. By keeping a close watch, you can avoid unnecessary investments in reliability while still meeting customer expectations.
9. Container Usage Metrics
After exploring error budget controls, let's delve into container usage metrics - a key tool for managing costs with precision. By keeping an eye on detailed resource usage, you can fine-tune allocations and avoid unnecessary expenses.
Core Container Metrics
Tracking specific metrics helps ensure resources are used efficiently. Here’s a quick breakdown:
| Metric Type | Alert Threshold | Monitoring Frequency |
|---|---|---|
| CPU Utilization | Sustained 80% for 15 minutes | Real-time |
| Memory Usage | 85% of allocation | Hourly |
| Storage Usage | 75% of allocation | Daily |
| Container Count | 20% increase per hour | Real-time |
| Network I/O | 40% above baseline | Hourly |
Budget Consumption Tracking
To prevent overspending, set up graduated alerts based on budget consumption. Here’s how to stay ahead:
| Budget Level | Action Required | Notification Target |
|---|---|---|
| 70% Consumed | Review scaling policies | DevOps Team |
| 85% Consumed | Implement cost controls | Team Managers |
| 95% Consumed | Take emergency action | Department Heads |
Resource Efficiency Monitoring
Cutting costs often starts with identifying inefficiencies. Look for containers that are idle, overprovisioned, or tied to non-critical tasks. Reclaiming these resources can significantly reduce expenses.
Tag Categories for Cost Attribution
Tagging resources is essential for tracking and managing costs effectively. Here are some useful tag categories:
| Tag Category | Purpose | Example |
|---|---|---|
| Business Unit | Assign costs by team | team:marketing |
| Environment | Track resource usage | env:production |
| Application | Map to specific apps | app:payment-api |
| Cost Center | Link to budgets | cost-center:sales |
| Lifecycle | Plan resource usage | status:temporary |
Cost Optimization Dashboard
A well-designed dashboard can bring all the important metrics together for better decision-making. Include the following elements:
- Total container costs compared to the allocated budget
- Daily cost trends with alerts for anomalies
- Heat maps showing resource utilization
- Breakdown of container counts by status and environment
- Per-container cost analysis
Automated Cost Controls
Automation can be a game-changer for managing container costs. Consider implementing these strategies:
- Automatically shut down non-production environments during off-hours
- Enforce scaling limits tied to budget thresholds
- Reclaim resources from idle containers
- Provide right-sizing recommendations based on actual usage patterns
10. Reserved Instance Usage
Managing reserved instance usage is a critical step in keeping cloud costs under control. By closely tracking these metrics in Datadog, you can ensure you're getting the most out of your investment while avoiding unnecessary expenses.
Key Utilization Metrics
Here are some essential metrics to monitor, along with recommended thresholds and actions:
| Metric Type | Alert Threshold | Action Required |
|---|---|---|
| Coverage Rate | Utilization <85% | Reevaluate workload distribution |
| Utilization Rate | Utilization <80% | Examine usage patterns |
| On-demand Spillover | Above 15% | Reassess reservation needs |
| Cost Savings Rate | Below 25% | Adjust instance allocation |
Real-time Monitoring Dashboard
Set up a specialized dashboard to track your reserved instance usage effectively. Include the following:
- Current utilization percentages with trend lines to spot patterns.
- Monthly cost savings compared to on-demand pricing for better financial insight.
- Coverage gaps across instance types to identify underutilized resources.
- Alerts to highlight significant deficiencies in reserved capacity.
Alert Configuration Strategy
Configuring alerts ensures timely action. Use the following thresholds and priorities:
| Utilization Level | Alert Priority | Notification Target |
|---|---|---|
| Utilization <75% | Medium | Resource Managers |
| Utilization <60% | High | Finance Team |
| Utilization <45% | Critical | Department Heads |
These alerts help teams take proactive steps toward reducing cloud costs.
Cost Optimization Tips
To make the most of your reserved instances, consider these strategies:
- Assign high-value workloads to reserved instances for maximum return.
- Ensure instance types align with actual usage needs to avoid waste.
- Monitor usage patterns across time zones and business hours for better distribution.
"Ongoing education and process refinement are key to sustaining cost efficiency and maximizing the value of reserved instances for growing businesses", as highlighted in Scaling with Datadog for SMBs.
Usage Pattern Analysis
Regularly analyzing usage patterns can reveal opportunities for improvement. Here's what to focus on:
| Analysis Type | Monitoring Frequency | Key Indicators |
|---|---|---|
| Usage Trends | Daily | Peak usage times |
| Weekly Cost Savings | Weekly | Savings comparison |
| Coverage Gaps | Monthly | Underutilized capacity |
| Reservation Fit | Quarterly | Alignment with instance types |
Automated Optimization
Take advantage of automation to streamline your reserved instance management:
- Automate alerts and schedule reports when thresholds are exceeded.
- Reallocate instances dynamically based on usage patterns.
- Keep dashboards updated for real-time tracking and decision-making.
Conclusion
Keeping a close eye on your budget in Datadog is all about combining thorough oversight with actionable insights. The metrics we’ve covered offer a clear view of cost drivers, helping you manage cloud resources effectively and proactively.
Integrated Monitoring Levels
Here's a breakdown of monitoring levels and their focus areas:
| Monitoring Level | Key Components | Review Frequency |
|---|---|---|
| Strategic | Error budgets, cost trends | Monthly |
| Operational | Host count, log volume, APM usage | Weekly |
| Technical | Custom metrics, RUM sessions, synthetic tests | Daily |
Key Practices for Effective Budget Monitoring
To make your monitoring strategy work, it’s essential to focus on both the technical setup and governance. Here’s how:
| Focus Area | Best Practice | Business Impact |
|---|---|---|
| Metric Selection | Prioritize KPIs like visitor count, basket size, and latency | Directly supports business goals |
| Cost Management | Leverage strategic tagging and conduct regular reviews | Keeps costs in check |
| Governance | Schedule quarterly reviews and assign metric ownership | Promotes sustainable monitoring practices |
| Technical Setup | Use Metrics Without Limits™ for flexible data retention | Balances granular data with cost efficiency |
Preparing for the Future
As your monitoring requirements grow, staying ahead of trends in Datadog cost management will be crucial. Features like machine learning-based anomaly detection and automated recommendations are set to play a bigger role in optimizing operations and managing expenses. These tools integrate well with the practices outlined above, ensuring your strategy evolves alongside your needs.
Actionable Recommendations
To stay on top of your cloud costs, consider these steps:
-
Monthly Cost Analysis
Regularly review all budget-related metrics to identify trends and opportunities for savings. -
Automated Monitoring
Set up alerts with clear thresholds and assign response teams to act quickly when needed. -
Continuous Optimization
Fine-tune your monitoring setup to reflect changes in usage patterns and business priorities.
FAQs
How can tagging in Datadog help me manage cloud costs more effectively?
Tagging in Datadog is an incredibly effective way to keep your cloud resources organized while keeping a close eye on costs. By adding tags - like those for teams, environments, or applications - you can group and filter data to pinpoint exactly where your expenses are coming from.
For instance, you can set up custom budget alerts tied to specific tags, helping you monitor spending for particular teams or projects. This makes it easier to spot high-usage areas, adjust resource allocation, and steer clear of unexpected expenses. Plus, tagging streamlines reporting, so you can clearly present insights to stakeholders and maintain accountability across your organization.
What are the best practices for creating budget alerts in Datadog to avoid unexpected cloud costs?
To keep cloud spending under control, setting up budget alerts in Datadog is a smart move. Here's how to approach it effectively:
Start by focusing on key cost-related metrics like total monthly expenses, service-specific usage, and costs broken down by team or project. These metrics give you a clear picture of spending patterns and help identify any problem areas.
When configuring alerts, establish thresholds that align with your budget. For instance, you could set notifications to trigger when 80% of your budget is used. This gives you a chance to respond before overspending occurs. Pair these alerts with real-time notifications - whether through email, Slack, or other tools - so you're instantly aware of any unexpected cost surges.
Finally, make it a habit to review and update your alerts as your cloud setup changes. This ensures your monitoring stays relevant and continues to meet your business goals.
How can I optimize system performance while managing costs in Datadog's APM and RUM services?
To strike the right balance between performance and cost in Datadog's APM (Application Performance Monitoring) and RUM (Real User Monitoring) services, start by zeroing in on the metrics that matter most to your business. Key areas to prioritize include request latency, error rates, and user session durations. These metrics give you a clear picture of system health without the risk of over-allocating resources.
Make use of Datadog's custom budget alerts to keep a close eye on spending. By setting thresholds for essential metrics, you can get notified when usage edges close to your budget limits. Another smart move is implementing sampling strategies, which help cut down data ingestion costs while still delivering actionable insights. With a well-tuned monitoring setup, you can ensure strong performance without breaking the bank.


