
5 Powerful Things You Can Do with the Datadog API Today
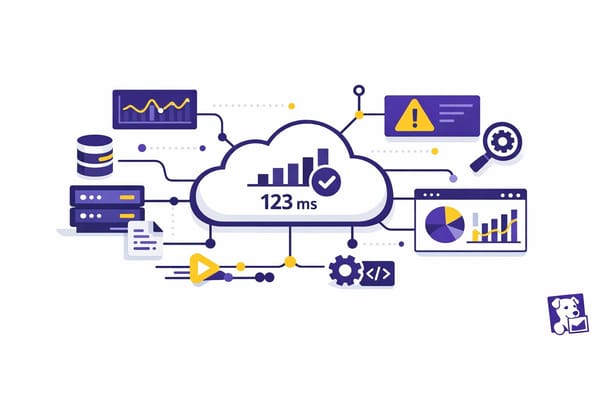
Use the Datadog API to automate monitoring: submit custom metrics, manage alerts and dashboards, query logs, and connect cloud services.

Use the Datadog API to automate monitoring: submit custom metrics, manage alerts and dashboards, query logs, and connect cloud services.

Forward Netlify traffic and function logs to Datadog, push custom build metrics, and build dashboards and alerts for long-term monitoring.

Guide to monitor MySQL with Datadog: create a monitoring user, enable Performance Schema, install the Agent, collect logs, configure alerts and build dashboards.

Troubleshoot Datadog log parsing by validating sources, fixing Grok/regex and timestamp issues, testing in Log Explorer, and monitoring parsing error metrics.
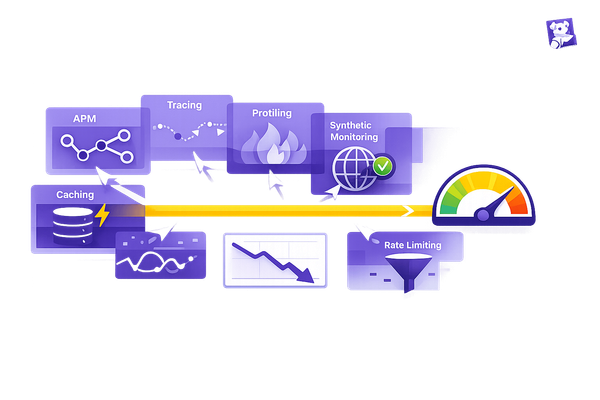
Use Datadog integrations—APM, tracing, profiling, and synthetic monitoring—plus caching and rate limiting to reduce API latency and pinpoint bottlenecks.
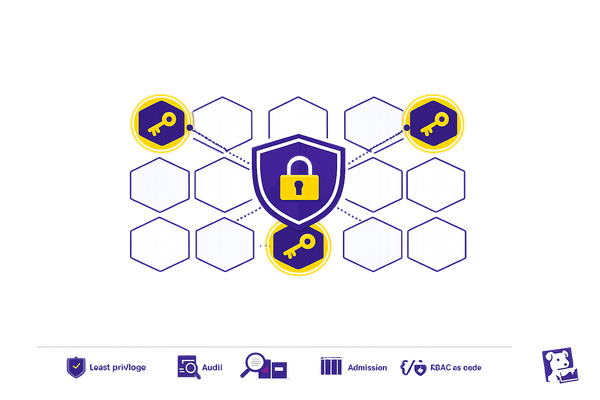
Secure Kubernetes with RBAC: grant minimal roles, avoid wildcards, audit policies, use admission controllers, and manage RBAC as code.
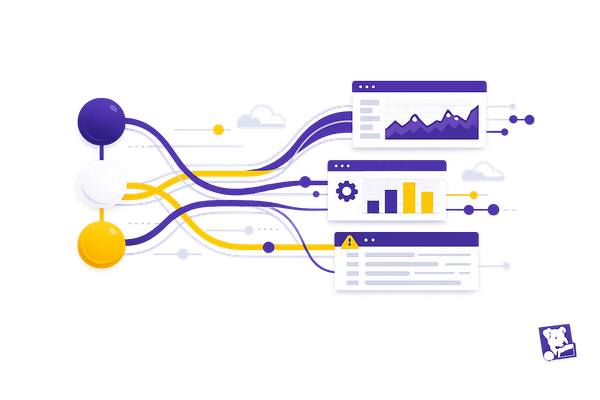
Send metrics, logs, and events via APIs for instant observability—covers auth, batching, error handling, rate limits, and scaling best practices.
Install and configure the Datadog Python API client: set DD_API_KEY/DD_APP_KEY, configure region, query metrics, and enable retries/debugging.
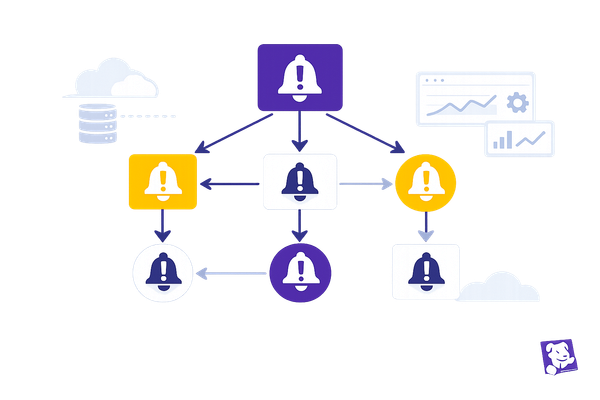
Set up parent-child alert dependencies to mute downstream alerts: identify monitors, add webhooks, call the Downtime API, test simulations, and maintain tags.
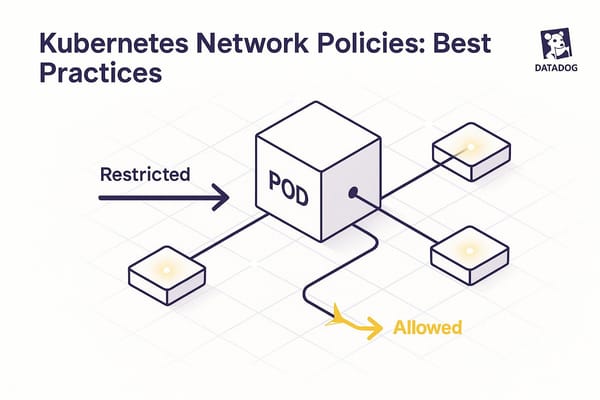
Enforce default-deny, precise allow-lists, egress controls, and monitoring to secure Kubernetes pods and meet compliance.
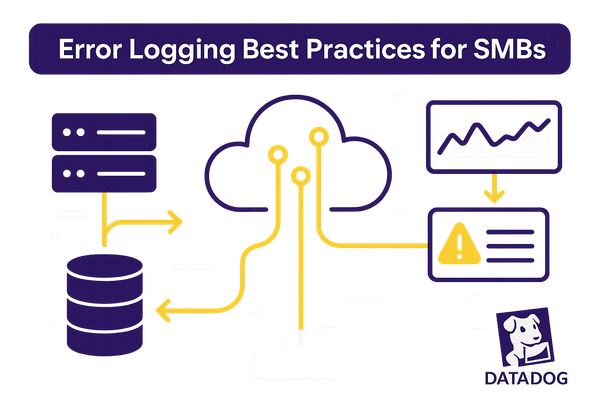
Clear error logging practices for SMBs: log critical events, use JSON structure, apply levels, enforce retention, and centralize logs to cut MTTR and costs.
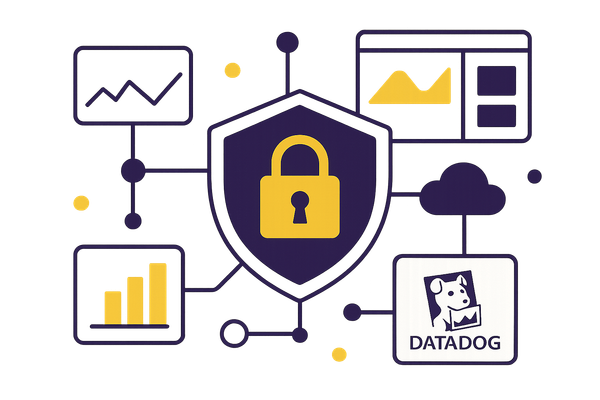
Step-by-step guide to configure Datadog for HIPAA: sign a BAA, enforce RBAC, enable encryption and Sensitive Data Scanner, set retention, audit logs, and alerts.