
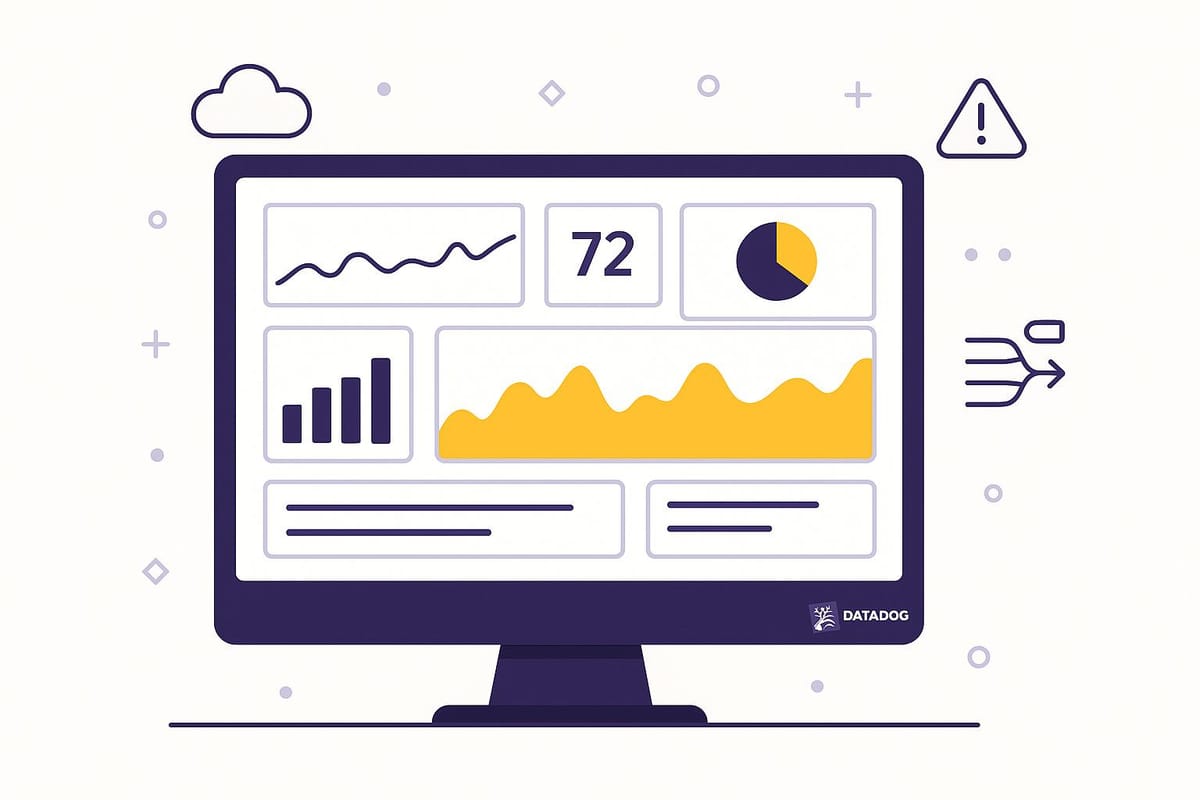
Common Datadog Dashboard Mistakes to Avoid
Learn to enhance your Datadog dashboards by avoiding common pitfalls that hinder insights and decision-making.
Want to make your Datadog dashboards more effective? Avoid these common mistakes that can waste time, obscure insights, and frustrate your team:
- Overloading with Metrics: Too many metrics clutter dashboards and confuse users. Stick to 5–8 key metrics that align with business goals.
- Using the Wrong Chart Types: Misused charts (e.g., 3D or overloaded visuals) distort data. Match charts to your data's story, like line charts for trends or bar charts for comparisons.
- Generic Dashboards: One-size-fits-all dashboards fail to meet specific team needs. Tailor dashboards for engineers, marketers, and executives to ensure relevance.
- Wrong Data Detail and Time Settings: Too much detail or mismatched time ranges can hide critical trends. Use appropriate granularity and timeframes for your goals.
- Ignoring Tags and Filters: Tags and filters organize data and improve navigation. Use template variables for dynamic, reusable dashboards.
- Slow Dashboard Performance: Overusing widgets or querying excessive data slows load times. Streamline dashboards and optimize settings for better performance.
Focus on clear, actionable dashboards to save time, improve decisions, and maximize your Datadog investment.
I06 Build Datadog Dashboards That Actually Help During Outages (Complete Guide)
Too Many Metrics on One Dashboard
Packing a dashboard with every possible metric can overwhelm your team and obscure the insights that truly matter. Instead of helping with system monitoring, an overloaded dashboard often creates confusion and slows down decision-making. Let’s break down why this happens and how to fix it.
Why Too Many Metrics Create Problems
When dashboards are cluttered with too many metrics, they become more of a hindrance than a help. As Khili Sharma explains:
Overloading dashboards with too many metrics often leads to confusion. Less is more when it comes to actionable insights.
The human brain has limits - it can only process so much information at once. Research shows that clear visuals can improve data retention by up to 80%. A dashboard crammed with widgets, charts, and graphs forces teams to sift through irrelevant data, wasting precious time during critical moments. This clutter makes it harder to identify trends, spot anomalies, and respond effectively when issues arise.
How to Pick Your Most Important Metrics
The key isn’t to eliminate metrics entirely but to be selective about what you include. Management expert Peter Drucker once said:
What gets measured gets managed.
But measuring everything? That’s a recipe for chaos.
Start by identifying your business objectives. Then, choose 5–8 key performance indicators (KPIs) that align with those goals. Using the SMART framework (Specific, Measurable, Achievable, Relevant, Time-bound) can help you zero in on the metrics that truly matter . If a metric doesn’t directly influence decision-making or contribute to your objectives, it’s time to cut it. As one expert noted:
The right KPIs act as a compass, guiding your business towards its goals.
This focused approach ensures your team concentrates on what drives success, rather than getting lost in irrelevant data.
Organizing Metrics for Clearer Views
Once you’ve selected the essential metrics, the next step is to organize them in a way that’s easy to understand. Each dashboard view should answer a specific question, like “Is my application healthy?”. Group related metrics together, and use tools like Datadog tags for dynamic filtering. These steps can improve efficiency by up to 30%.
For example, you could organize metrics into categories like database performance, application response times, and infrastructure health. Adding tags for regions, services, or teams allows users to filter the dashboard to see only the data they need - no extra versions required. Instead of showing metrics for every service all at once, include a dropdown menu so users can select the specific service they want to monitor. This keeps the dashboard clean while still providing comprehensive access.
A well-organized dashboard doesn’t just look better - it helps your team work smarter. By reducing clutter and focusing on what matters, you’ll save time, allocate resources more effectively, and make faster, more informed decisions. For small and medium-sized businesses, these improvements can have a big impact on growth and success.
Using the Wrong Chart Types
Choosing the wrong type of chart can make it harder to understand your data and lead to poor decision-making. A misstep here doesn’t just make your dashboard look less professional - it also muddles the story your data is trying to tell.
Common Chart and Graph Mistakes
A frequent misstep is using pie charts in the wrong context. While great for showing proportions, they falter when dealing with too many categories. The more slices you add - especially if they’re similar in size - the harder it gets to interpret the data. For example, a pie chart showing server response times across multiple services might leave your team guessing instead of gaining clarity.
Another trap is the allure of 3D charts. They may look flashy, but they distort your data and make accurate interpretation nearly impossible. For instance, a 3D bar chart can exaggerate differences or obscure relationships, leading to confusion.
Line charts are often misused as well. These are designed to show trends over time, but teams sometimes apply them to categorical data - like comparing server types - where they don’t belong.
The biggest mistake? Overloading a single chart with too much information. When you cram excessive data into one visualization, it overwhelms the viewer and defeats the purpose of simplifying insights. As statistician John Tukey once said:
The greatest value of a picture is when it forces us to notice what we never expected to see.
Picking the Right Chart for Your Data
Once you’re aware of these pitfalls, the next step is choosing the right chart for your data. Start by asking yourself: "What do I want my team to understand?" Your choice of chart should align with the story your data is telling.
For most Datadog metrics, a simple time series chart is a solid starting point. It’s versatile and clearly shows changes over time. From there, you can experiment with other visualization types to find the one that best highlights your data’s key message.
Here’s a quick guide to help match your data with the right chart:
| Chart Type | Best For | Example Use Case |
|---|---|---|
| Line Chart | Trends over time, continuous data | CPU usage over the last 24 hours |
| Bar Chart | Comparing categories | Response times across different services |
| Pie Chart | Showing parts of a whole | Breakdown of error types (max 5–6 slices) |
| Heat Map | Patterns across two dimensions | Server performance by time and region |
For example, if you’re comparing revenue across business units, a bar chart will make differences clear. Meanwhile, time-based data like application response times is best suited to a line chart, which can reveal trends, spikes, or patterns at a glance.
As Dante Vitagliano, a data visualization expert, explains:
Data visualization is the language of decision-making. Good charts effectively convey information. Great charts enable, inform, and improve decision making.
The goal is to create visuals that help your team make faster, smarter decisions.
Keeping Visual Styles Consistent
Consistency in visual styles makes dashboards easier to read and interpret. When charts use different colors, fonts, or styles, your team spends unnecessary time deciphering the visuals instead of focusing on the data.
Stick to a unified color palette. For instance, if red indicates "critical alerts" in one chart, it should mean the same across all dashboards. Similarly, use the same font and text sizes throughout to maintain a polished, cohesive look.
Clear and consistent labeling is equally important. Axes, legends, and data points should follow the same naming conventions across all charts. For example, if one chart labels a metric as "Response Time (ms)", avoid calling it "Latency" elsewhere.
Edward Tufte, a pioneer in data visualization, advises:
Make all visual distinctions as subtle as possible, but still clear and effective.
This means using enough contrast to highlight differences without overwhelming the viewer with excessive colors. Additionally, keeping consistent time ranges - like always showing the last hour on your main dashboard - helps users develop a reliable sense of what "normal" looks like.
Not Customizing Dashboards for Different Users
A one-size-fits-all dashboard might seem convenient, but in reality, it often fails to meet anyone's needs effectively. Your DevOps engineer doesn't require the same metrics as your sales manager, and your CEO shouldn't have to sift through server response times to find key business indicators. When a dashboard tries to cater to everyone, it ends up being useful to no one. Let’s dive into why tailoring dashboards to specific roles is essential for smoother operations.
Problems with Generic Dashboards
As mentioned earlier, cluttered dashboards can slow down decision-making. Generic ones take this a step further by failing to align with the unique needs of different teams. The biggest issue? Information overload. When dashboards are packed with irrelevant data, users are more likely to feel overwhelmed and miss the insights they actually need.
Take this example: A marketing team doesn't need to see database metrics - they're focused on conversion rates and campaign performance. When irrelevant data clutters their view, important insights get buried.
Another challenge is that generic dashboards don’t account for how different teams work. Teams have varied workflows for analyzing issues and making decisions. For instance, engineers often need to drill down from broad alerts to detailed server metrics. On the other hand, business teams are more interested in long-term trends, like weekly or monthly performance, rather than minute-by-minute data.
On top of that, complex, one-size-fits-all dashboards make navigation frustrating. This discourages regular use, which ultimately reduces the value of the system.
Creating Dashboards for Specific Teams
The fix? Build dashboards that are tailored to the needs of each team. This doesn’t mean creating entirely separate systems - instead, it’s about organizing the same data in ways that make sense for different roles.
Here’s how you can approach it:
- Engineering teams need a focus on system health. Their dashboards should highlight metrics like error rates and response times. Using tags such as
team:backend,service:web-store, orseverity:highcan make filtering data quick and easy. Add widgets for real-time alerts, performance trends, and troubleshooting tools to give engineers the detailed view they need. - Business teams care about high-level KPIs and trends that tie directly to revenue and customer experience. Their dashboards should prioritize metrics like conversion rates and user engagement, showing how system performance impacts business outcomes.
- Management and leadership require insights that are ready for boardroom discussions. They don’t need technical details cluttering their view. Instead, their dashboards should focus on key business metrics, offering context on the numbers and outlining any necessary actions.
Here’s how these tailored dashboards might look:
| Team | Key Metrics | Dashboard Focus | Time Range |
|---|---|---|---|
| Engineering | Response times, error rates, server health | Real-time monitoring and troubleshooting | Last 15 minutes to 24 hours |
| Marketing | Conversion rates, traffic sources, page load impact | Campaign performance and user experience | Last 7 days to 30 days |
| Executive | Revenue impact, uptime SLA, customer satisfaction | Business outcomes and strategic insights | Monthly and quarterly trends |
To keep dashboards flexible but uncluttered, use template variables. For example, engineers could toggle between production, staging, and development environments, while marketers could filter by campaign or traffic source.
Additionally, customize mobile dashboards for quick access to on-call alerts or sales data. Tailored dashboards ensure that every team gets the information they need - without the noise.
Wrong Data Detail Levels and Time Settings
Getting the right balance of data detail in dashboards is essential for effective monitoring. Too much granularity can overwhelm users with noise, while overly broad summaries can hide critical insights. Similarly, selecting the right time ranges is just as important - they dictate whether you catch issues early or let them slip by unnoticed. Striking this balance ensures your monitoring aligns with your objectives.
Why Data Detail Level Matters
Think of data granularity like adjusting a camera lens: zooming in too much can make you lose the bigger picture, while zooming out too far can blur important details. Striking the right balance between detail and usability is key in creating effective dashboards.
Dashboards that rely on overly granular data - like second-by-second metrics for long-term analysis - can create unnecessary noise. This makes it harder to spot actionable trends and can leave teams confused about whether a quick spike is a real issue or just normal fluctuation.
On the flip side, oversimplified reporting can be just as harmful. When dashboards oversimplify data, critical details can disappear, leading to poor decision-making. For example, hourly averages might smooth over brief but significant outages, masking problems that need attention.
The solution? Match your data granularity to your monitoring goals. For incident troubleshooting, minute-level data can help pinpoint issues with precision. For broader business reviews, daily or hourly summaries provide clear trends without overwhelming detail.
Companies that focus on user-friendly monitoring report a 30% boost in efficiency. This highlights the importance of displaying data in a way that supports better decisions. One approach is to start with broader intervals on your main dashboard and let users drill down into more granular data as needed. For instance, your default view might show hourly response times over the past week, but clicking on a spike could reveal minute-by-minute details for that specific time.
Once you've optimized data granularity, the next step is to fine-tune your time ranges to match the natural rhythm of your systems.
Setting the Right Time Ranges
Different systems and metrics require tailored time windows. Real-time systems benefit from minute-level views, while content platforms often need broader, daily trends.
A common mistake among SMBs is applying the same time range - often the last 24 hours - to every dashboard. This "one-size-fits-all" approach ignores the unique rhythms of different metrics. For example, website traffic might be best analyzed over a week or a month to capture weekday versus weekend trends, while memory usage spikes need much shorter time frames to be meaningful.
SMBs should align dashboard time ranges with their specific monitoring goals and the natural lifecycle of the metrics they track. Here’s a practical framework to consider:
- For real-time monitoring, use a range of 15 minutes to 4 hours. This works well for metrics like CPU usage, memory consumption, and error rates - providing an up-to-date snapshot for on-call teams.
- For trend analysis, extend the view to 7 or 30 days. This helps identify patterns in user behavior, recurring performance issues, or the impact of recent updates.
- For capacity planning, look at data over 3 to 12 months. A longer window is ideal for predicting when scaling resources or adjusting budgets might be necessary.
The frequency of data updates and the typical duration of incidents should guide your time range choices. For example, if issues typically resolve within 30 minutes, a 4-hour view can provide enough context to understand the problem and its resolution. For batch jobs that run overnight, a 24-hour view might be more appropriate.
Ultimately, your dashboards should help the team quickly answer: "Is this normal?" When time ranges are tailored to your system's behavior and urgency, it's much easier to spot patterns and respond effectively.
Not Using Tags and Filters
One of the most frequent pitfalls in designing Datadog dashboards is failing to use tags and filters effectively. Without these tools, dashboards can quickly become a chaotic mess, filled with irrelevant data that slows down responses and makes it harder for teams to focus on what matters.
Tags, structured as key–value pairs, provide crucial context to performance and infrastructure data. Ignoring tags leads to cluttered dashboards and delays in addressing incidents. However, when used properly, tags turn overwhelming data streams into neatly organized and searchable information. This makes it easier for teams to identify the affected service, environment, or region during an incident - saving valuable time.
How Tags Help Organize Your Data
Tags are the foundation of well-organized data in Datadog. They allow users to group complex data streams in ways that align with their infrastructure and business needs, regardless of roles, environments, or locations.
One of the biggest advantages of tags is their automatic integration. Many modern platforms and tools - like AWS, Kubernetes, and Chef - automatically generate and apply tags. For example, AWS automatically tags resources with attributes like "availability-zone", "instance-type", and "security-group", providing instant categorization for your infrastructure metrics.
Custom tags, on the other hand, are indispensable for managing dynamic environments. They unify metrics, traces, and logs, creating meaningful contexts that reflect your team’s operations. Examples of custom tags include "environment:production", "team:backend", "service:payment-processor", or "region:us-east-1." These tags allow for targeted insights, such as viewing all services tied to a specific environment or location through Datadog’s service map. Tags for environments or data centers also enable quick filtering, helping teams zero in on relevant data.
Using Filters to Get Better Data Views
Filters take tagging a step further by transforming your dashboards into highly interactive tools. For instance, template variables allow you to scope dashboards to specific contexts using tags. These variables often appear as dropdown menus at the top of your dashboard, making it easy to toggle between environments, services, or regions.
Template variables are especially useful for creating reusable dashboards. With just a dropdown, you can switch between production and staging environments or focus on specific applications and endpoints. For example, in a Docker setup, tags like "env", "aws_account", "image_name", and "container_id" let you dynamically filter data.
Fine-tuning these filters is just as important. Configuring available values for template variables ensures you focus on the most relevant data while filtering out unnecessary noise. Saved views further enhance collaboration by preserving the scope of dashboard visualizations, making it easy to share insights with your team.
Dashboard Speed and Performance Issues
When dashboards run slowly, it’s more than just an inconvenience - it can seriously hinder monitoring efforts and frustrate your team. Research shows that 70% of users abandon complex data views that take too long to load. This can leave critical gaps in your monitoring strategy, especially during incidents when quick decisions are essential.
But the impact isn’t just operational. Slow dashboards can also inflate your Datadog costs by consuming more resources while delivering less value. For small to medium-sized businesses (SMBs) working with limited budgets, this inefficiency can quickly become a financial burden. Below, we’ll explore how to optimize dashboards for better performance.
How Complex Dashboards Cause Delays
One of the main reasons dashboards slow down is the overuse of widgets. Each widget requires its own data query, so a dashboard filled with dozens of widgets forces Datadog to process multiple queries at once. High-cardinality data queries - those involving metrics with thousands of unique tag combinations - add another layer of complexity, significantly slowing down load times.
Timeframe settings also play a big role. For example, querying six months of historical data for real-time monitoring can unnecessarily strain the system. Add to this the load from real-time widgets, which require constant updates, and complex visualizations with overlays, annotations, and custom formatting, and you have a recipe for sluggish performance.
Here’s a quick look at how different widget types affect performance:
| Widget Type | Impact on Performance | Recommended Sampling Rate |
|---|---|---|
| Real-time Data | High Load | Every 10 seconds |
| Aggregated Metrics | Moderate Load | Every minute |
| Historical Data | Low Load | Hourly or daily |
Tips to Improve Dashboard Load Times
To speed up your dashboards, start by cutting the clutter. Use fewer widgets and set timeframes that align with the dashboard’s purpose. Instead of trying to capture everything in one place, create targeted dashboards tailored to specific needs.
Caching is another powerful tool. Configure widgets to cache frequently accessed data, especially for metrics that don’t change often. This reduces the number of fresh queries needed every time the dashboard loads.
Eliminate unnecessary visual elements like duplicate metrics or decorative features that don’t add value. Group related metrics together for easier comparison. For instance, instead of separate visualizations for CPU, memory, and disk usage, combine them into a single multi-metric view that’s both clear and efficient.
Using template variables can also make a big difference. A single dashboard with dropdown filters allows users to dynamically adjust their view, eliminating the need for multiple static dashboards for different environments.
Finally, regular maintenance is key. Review usage patterns to identify underused widgets and remove them. Establish clear naming conventions to help users quickly find the information they need.
Conclusion: Building Better Dashboards for SMBs
Dashboards are more than just a collection of metrics - they're a tool to maximize your monitoring investment. By avoiding common pitfalls, your business can unlock clearer insights, make faster decisions, and see better returns on your monitoring efforts.
Streamlined monitoring can significantly improve efficiency. Take Anaplan, for instance. In September 2024, they slashed their mean time to acknowledge incidents from 2–3 hours to just 5 minutes. How? By cutting out unnecessary alerts and fine-tuning their monitoring systems. This adjustment didn’t just save time - it saved them an estimated $250,000 annually and enhanced customer satisfaction.
"By leveraging PagerDuty, Anaplan has minimized the resources needed for an incident and helped reduce our outage times, customer escalations and – in the end – helped save Anaplan a lot of money."
– Ankush Mattoo, Senior Service Manager, Anaplan
For SMBs, such optimizations are essential. With 32% of cloud budgets reportedly wasted and 60% of professionals highlighting inflated cloud bills, well-designed dashboards become a powerful tool to manage and control costs.
Datadog, with its integration capabilities across over 850 tools, offers SMBs the flexibility to create dashboards tailored to their specific needs. The process of building better dashboards doesn’t end once they’re set up. Focus on metrics that directly impact your bottom line, customize views for different team roles, and regularly review performance to identify and address bottlenecks.
A thoughtfully designed dashboard serves as a reliable source of truth. It speeds up incident resolution, sharpens decision-making, and allows teams to catch issues early, leading to smoother operations. By steering clear of the common mistakes outlined here, your SMB can fully realize the operational and financial advantages of your Datadog investment.
For more insights and expert tips, check out Scaling with Datadog for SMBs and keep refining your dashboards for even greater success.
FAQs
How do I choose the right metrics for my Datadog dashboard to keep it clear and focused?
To keep your Datadog dashboard streamlined and effective, start by pinpointing the key performance indicators (KPIs) that align closely with your business objectives. Consider what you want the dashboard to achieve - whether it's tracking system performance, monitoring user experience, or maintaining application health. Focus on metrics that drive actionable insights, such as response times, error rates, or resource usage.
Leverage Datadog's built-in tools to filter, group, and visualize your data, ensuring that only the most relevant information is displayed. This approach keeps your dashboard clean and easy to navigate. Make it a habit to regularly review and update your metrics to match shifting business priorities, avoiding clutter and unnecessary details.
What are the best practices for selecting the right chart type for your data in Datadog dashboards?
Creating effective Datadog dashboards begins with selecting the right type of chart for your data. For example, line charts work well to show time-series trends, while bar charts are ideal for comparing different categories. Use pie charts sparingly, as they’re best suited for illustrating proportions but can quickly become hard to interpret.
To keep your dashboards clear and actionable, limit the number of metrics displayed. Focus on the most critical KPIs to ensure key insights stand out. Maintaining a consistent color scheme and layout also plays a big role in improving readability and making the user experience smoother.
By sticking to these guidelines, you’ll create dashboards that make it easier to analyze data and support better decision-making.
How can I customize Datadog dashboards to meet the unique needs of different teams in my organization?
To design dashboards that align with your teams' specific needs, start by identifying their monitoring priorities. For a broad visual summary, Screenboards work best, while Timeboards are ideal for in-depth, time-based analysis. Arrange dashboards so the most critical metrics are easy to spot at the top, and group related data in a way that feels logical and easy to navigate.
Keep the layout clear and user-friendly by limiting the number of widgets. Overloading a dashboard can make it harder to use. Rely on essential widgets like Timeseries to showcase trends and Query Values for highlighting key metrics. Stick to consistent color schemes and layouts to create a polished, cohesive look. Make it a habit to collect feedback from team members periodically to tweak and improve dashboards as their needs evolve.
Thoughtfully crafted dashboards help teams zero in on the data that matters most, boosting both productivity and smarter decision-making.


