
How to Monitor GitHub Actions with Datadog
Learn how to effectively monitor GitHub Actions with Datadog for improved CI/CD workflows, real-time insights, and faster issue resolution.
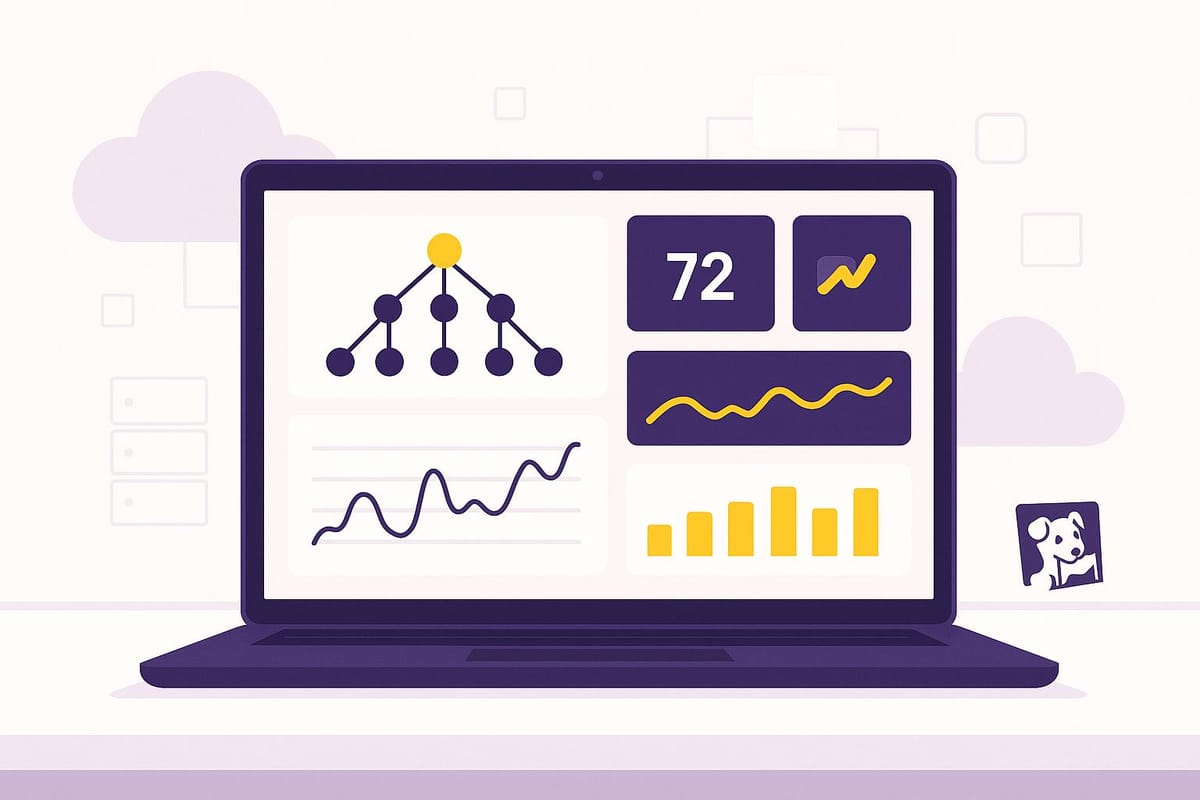
GitHub Actions can be a powerful tool for automating your CI/CD workflows, but monitoring them effectively is key to maintaining performance and catching issues early. Datadog’s CI Visibility simplifies this by providing metrics, logs, and traces for your pipelines - all in one place. Here's what you need to know:
- Track Key Metrics: Monitor success rates, execution times, and resource usage.
- Pinpoint Issues Faster: Link failures to specific commits or workflow stages.
- Save Time and Costs: Centralize monitoring for $8/committer/month, reducing the need for multiple tools.
- Easy Setup: Integrate GitHub Actions with Datadog in just a few steps, including enabling CI Visibility and configuring dashboards.
GitHub app for Datadog: How to Get Started
Prerequisites and Setup Requirements
Before you start monitoring GitHub Actions with Datadog, make sure you've met the necessary prerequisites. Below, you'll find steps for setting up your Datadog account, configuring your GitHub repository, and verifying supported environments to ensure everything runs smoothly.
Datadog Account Setup
To enable full pipeline monitoring, configure your Datadog account with CI Visibility. You'll need administrative access to activate this feature and integrate GitHub.
In the CI Visibility settings, select GitHub as your CI provider and adjust permissions to allow access to repository data. Navigate to CI Visibility > Settings to enable logging and monitoring for the repositories you want to track.
Keep in mind that enabling job logs collection - useful for debugging - comes with additional charges. Activate it only if your team frequently needs detailed logs for troubleshooting.
GitHub Repository Configuration
Proper permissions are critical for integrating GitHub with Datadog. When you add the GitHub integration in Datadog, the Datadog GitHub App is automatically installed in your GitHub organization. This app is configured with the necessary permissions to ensure seamless functionality.
To enhance deployment workflows, enable GitHub Deployment Protection Rules and add the git_env and git_repo tags. These tags allow Datadog to apply protection rules to your GitHub Actions deployments.
Supported Environments and Tools
Once your Datadog account and repository permissions are set up, confirm that your environment supports the integration. Datadog and GitHub Actions work across various environments without requiring extra third-party tools.
For organizations that need to update Datadog's Service Catalog while maintaining strict security boundaries, the Datadog Service Catalog Metadata Provider (DSCMP) is available on the GitHub Marketplace. This GitHub Action lets you manage service definitions securely.
"Easy to set up." – Dev Shah, Staff SRE at VTS
"Had all the features we needed AND more - Logging, monitoring dashboards, pipeline observability, dependency analysis, alerting, CI/CD synthetics & monitoring self-hosted infrastructure." – Dev Shah, Staff SRE at VTS
The integration is compatible with both cloud-hosted and self-hosted GitHub environments. If you're using GitHub Enterprise Server, the setup process is similar, though you may need to configure additional network access for Datadog to communicate with your GitHub instance.
For tracking GitHub Actions metrics, consider using the int128/datadog-actions-metrics action. This tool sends specific metrics to Datadog based on workflow events, helping you monitor performance and business-related metrics tied to your CI/CD pipelines.
If your team already relies on Datadog for other monitoring tasks, you'll find the interface familiar, which reduces the learning curve.
Setting Up the Datadog and GitHub Actions Integration
Once you've completed the prerequisites, you can connect GitHub Actions to Datadog in three steps: configure the GitHub integration, enable CI Visibility, and test the setup. Below is a detailed guide to help you through the process.
Configuring the GitHub Integration in Datadog
Start by opening the GitHub Apps integration tile in your Datadog account. This is where you manage permissions and set up data collection for your GitHub repositories. In the integration settings, grant Datadog access to specific accounts and repositories. You can select which repositories to monitor, ensuring that Datadog only collects data from the ones you choose.
Next, configure Datadog to gather workflow execution details, job performance metrics, and, if needed, detailed logs. The integration will automatically install the Datadog GitHub App in your GitHub organization. This app handles data transfer between GitHub Actions and Datadog securely, eliminating the need for manual token management.
Enabling CI Visibility for Workflows
Once the integration is configured, enable CI Visibility for your workflows. Head to CI Visibility > Settings in the Datadog dashboard and choose GitHub as your CI provider. From here, you can enable CI visibility and logging for the repositories you want to monitor. This feature allows you to toggle monitoring on or off for individual repositories, which is particularly helpful if you're managing multiple projects at different stages of development.
Organizations that have implemented CI Visibility report benefits like centralized logging and quicker issue resolution. This setup not only streamlines error identification but also supports long-term analysis by providing detailed monitoring and observability.
Testing and Verifying the Integration
To ensure everything is working correctly, test the setup by triggering a workflow in GitHub Actions. Once the workflow runs, check Datadog's CI Visibility section to confirm that data is being captured.
Go to the Pipeline Executions page in Datadog, where you can filter workflows by criteria like CI provider, pipeline duration, and status. Your test workflow should appear here, complete with execution details, timing data, and status indicators.
For a deeper dive, inspect individual workflow runs on the Pipeline Details page. This will show you recent health and performance metrics. If you've enabled job logs collection, the Logs tab will display correlated log data, including specific spans from the flame graph.
If your CI/CD process includes Synthetic tests, their results will automatically show up in the Datadog CI Results Explorer. For troubleshooting, you can review commit details under the Info tab. Additionally, the integration supports Log Anomaly Detection, which highlights spikes in logs with error statuses, helping you quickly identify and address issues.
Once you've verified that workflow data is appearing correctly in Datadog, you can start leveraging features like facets - such as ci_provider, test_id, and branch - to analyze your CI/CD data effectively.
Monitoring and Visualizing GitHub Actions Workflows
When GitHub Actions is part of your development process, having a solid monitoring system can help you catch problems early and gain valuable insights into your workflows.
Setting Up Monitors and Alerts
To keep your workflows on track, focus on monitoring key metrics like success rates, execution times, and queue durations. For example:
- Set up a monitor to track CI success rates and trigger an alert if they fall below 90%.
- Configure alerts for execution times that exceed last week’s average by 20%.
- Monitor queue times, and fire an alert if securing a GitHub Actions runner takes more than 120 seconds.
A real-world example of this approach comes from VTS Engineering, which adopted these practices in June 2024 to address challenges in tracking historical CI runs and identifying bottlenecks. Dev Shah, Staff SRE at VTS Engineering, described their strategy:
"If CI success rate < 90%, fire an alert. If CI workflow duration is 20% higher than last week, fire an alert. If CI queue time (time required to grab a runner) is > 120s, fire an alert".
This method helped them detect and resolve errors faster by centralizing logging, monitoring, and observability - striking a balance between being thorough and avoiding unnecessary noise. Once monitoring is in place, the next step is to visualize these metrics for deeper analysis.
Creating Dashboards for Metrics
Dashboards transform raw data into actionable insights by presenting it visually. Start by building a central dashboard that brings together your critical CI/CD metrics. Here’s what to include:
- Pipeline execution trends: Use visualizations to track daily and monthly build counts and job duration trends over time.
- Success and failure patterns: Create widgets to compare success rates with failure trends, helping you identify connections between workflow issues and recent code changes or infrastructure problems.
- Benchmarks and baselines: Add widgets that compare current metrics - like execution times, queue durations, and resource usage - against historical averages to spot anomalies quickly.
These dashboards provide real-time updates on alerts and performance, while long-term trend analysis supports decisions around scaling or optimizing workflows. For example, if your build volumes or test durations are increasing, it might be time to consider scaling or parallelizing your infrastructure.
Tools like Datadog’s CI Visibility can take this further by linking performance metrics with logs, allowing you to dive deeper into the root causes of issues.
Configuring Targeted Notifications
To ensure critical issues don’t go unnoticed, set up targeted notifications. Datadog’s Log Anomaly Detection, for instance, can automatically alert you to unusual pipeline activity or log spikes. This automation reduces the need for constant manual monitoring and ensures that significant problems are flagged for immediate attention.
Tips and Best Practices for SMBs
Small and medium-sized businesses (SMBs) can get the most out of Datadog's GitHub Actions integration by adopting a thoughtful and strategic monitoring approach.
Efficient Monitoring for SMBs
When using the GitHub Actions and Datadog integration, SMBs should focus on creating a streamlined monitoring process. Start by setting up a dashboard that highlights critical CI/CD components and common failure points. Running a simple job to check your system’s baseline health can help you understand its current state. From there, configure monitors and establish performance baselines to measure the impact of any changes or optimizations you make. This targeted approach ensures your monitoring setup is ready to grow alongside your workflows.
Scaling Monitoring as Workflows Grow
As your team expands and CI/CD usage increases, your monitoring needs will naturally become more complex. Regular pipeline reviews are essential to catch and resolve issues early. When systems scale, it can be tricky to pinpoint whether a problem is due to a recent code change or external factors like capacity limits or CI provider outages. To stay ahead of potential issues, track both absolute and relative changes in job duration and failure rates. Datadog’s dashboards make it easier to monitor runner performance and identify trends, helping you spot performance dips before they become bigger problems. Once you’ve identified trends, you can explore ways to improve efficiency and manage costs.
Cost-Effective Use of Datadog Features
To control expenses while maximizing Datadog’s value, it’s important to understand its pricing model. Datadog CI Visibility costs $8 per committer per month - or $12 on-demand - with no charges for GitHub bots. This usage-based pricing allows you to start small and scale as your team grows. For log management, focus on ingesting actionable logs, as pricing is based on the volume of ingested and scanned logs. To further manage costs, take advantage of automation tools like Datadog’s Log Anomaly Detection. This feature automatically flags spikes in error logs, reducing the need for constant manual monitoring.
Troubleshooting and Maintenance
Once you've set up the Datadog-GitHub Actions integration, ongoing troubleshooting and maintenance are essential to keep your CI/CD pipelines running smoothly. Even with a solid configuration, problems can still arise.
Common Integration Issues and Solutions
Some frequent challenges include slow build times, failed executions, and performance bottlenecks that can disrupt your workflow. Instead of revisiting general functionality, focus on pinpointing specific issues.
Job logs are a key resource - they provide detailed information about the commands and system responses leading up to an error. If you're dealing with lengthy build times, compare your current code with previous commits and analyze historical trends. Datadog's Log Anomaly Detection can also be a game-changer, automatically flagging spikes in error logs before they become bigger problems.
After addressing individual issues, make it a habit to evaluate the integration's overall health to spot new anomalies early.
Checking Integration Health
Routine checks ensure that your monitoring data remains reliable. Start by creating a dashboard that gives a quick, high-level view of critical CI/CD components and common failure points. Set up a mix of monitors to track both absolute metrics (like job duration) and relative changes (such as failure rate trends). This approach helps identify pipeline weaknesses and areas ripe for improvement.
Running a baseline job - often called a "dial tone" - is another effective strategy. This simple test can quickly reveal issues with your CI provider or infrastructure. Dashboards should also monitor the health of individual pipelines, stages, and jobs. If you notice incomplete or outdated data, double-check your GitHub Actions workflow configurations to ensure all steps are functioning as expected.
Updating Configurations Over Time
As your workflows evolve, keeping your configurations up-to-date is crucial for accurate monitoring. Pay special attention to trigger setups - misconfigured triggers can overload Service Catalog APIs, waste GitHub Actions minutes, and cause erratic behavior.
To protect sensitive information, store API keys securely using GitHub Secrets management. Stick to trusted actions from verified sources in the GitHub Marketplace to minimize security risks. Additionally, maintain centralized controls within your organization and use clear error messages to communicate compliance issues.
Always test configuration updates in a staging environment, and closely monitor the integration afterward to ensure data flows correctly and no new problems emerge.
Conclusion
Integrating Datadog to monitor GitHub Actions brings a new level of clarity to CI/CD pipelines, especially for small and medium-sized businesses (SMBs). The process involves setting up the GitHub integration in Datadog, enabling CI Visibility for your repositories, and designing targeted monitors and dashboards to track workflow performance in real time.
Success starts with a step-by-step approach. Begin by focusing on your most critical workflows, then gradually expand coverage as your team becomes more comfortable with the platform. Enable job log collection only for workflows that require detailed troubleshooting - this helps manage costs while keeping visibility on essential processes.
What sets this integration apart is its end-to-end visibility. By providing data on metrics, distributed traces, and job logs, teams can quickly identify bottlenecks, optimize build times, and ensure reliable software delivery. These benefits are especially valuable for SMBs operating with tight resources.
Regular maintenance is essential to keep your monitoring setup effective. Periodically review which repositories need monitoring, adjust alert thresholds to match workflow scaling, and update configurations as team structures evolve. Datadog’s granular controls make it easy to tailor monitoring to specific projects and teams.
For SMBs aiming to get the most out of their investment, the Scaling with Datadog for SMBs blog offers advanced tips on optimization and scaling strategies. The platform’s flexibility allows you to start small and grow your monitoring capabilities alongside your development processes.
With the right setup and consistent upkeep, Datadog transforms GitHub Actions from a mysterious process into a transparent and efficient part of your workflow. The result? Faster issue resolution, improved team productivity, and more reliable deployments - essential tools for any development team.
FAQs
How can enabling CI Visibility in Datadog enhance monitoring for GitHub Actions workflows?
Enabling CI Visibility in Datadog provides a clear window into your GitHub Actions workflows. This feature lets you keep tabs on pipeline performance, spot bottlenecks, and resolve issues swiftly, ensuring your workflows stay on track.
By leveraging detailed metrics and traces, you can monitor the health of every step in your workflows, fine-tune execution times, and maintain dependable CI/CD operations. This level of insight helps you address inefficiencies head-on and enhances the overall performance of your systems.
What does it cost to monitor GitHub Actions with Datadog, and how can businesses manage these expenses effectively?
The cost of using Datadog to monitor GitHub Actions depends on several factors, including the volume of metrics, logs, and custom metrics you send. While pricing can vary, there are practical ways to manage these expenses.
Start by focusing on the essentials - send only the metrics and logs that are truly relevant to your workflows. Regularly review your data collection to eliminate anything unnecessary. Opting for yearly contracts can also help, as they often include discounted rates. Additionally, take advantage of Datadog's built-in tools, like monitors and CI visibility, to streamline your monitoring efforts and keep costs manageable.
With thoughtful usage and smart use of Datadog’s features, you can stay on top of your GitHub Actions workflows without stretching your budget.
How can I troubleshoot common problems after connecting Datadog to GitHub Actions?
To tackle issues after integrating Datadog with GitHub Actions, start by ensuring the Datadog agent is installed and set up correctly. Check if the integration is active by confirming it appears under the running checks in the Datadog Agent. You can use the Datadog CLI to inspect the status of current integrations.
Then, review the GitHub Actions logs alongside Datadog metrics to identify any errors or missing data. Pay close attention to common culprits like incorrect API keys, inadequate permissions, or network connectivity problems. If the issue remains unresolved, consider consulting GitHub or Datadog community forums for advice tailored to specific error messages or scenarios.
Following these steps methodically can help you pinpoint and resolve most integration challenges, keeping your GitHub Actions monitoring on track.


