Real-Time Data Ingestion with Datadog APIs
Send metrics, logs, and events via APIs for instant observability—covers auth, batching, error handling, rate limits, and scaling best practices.
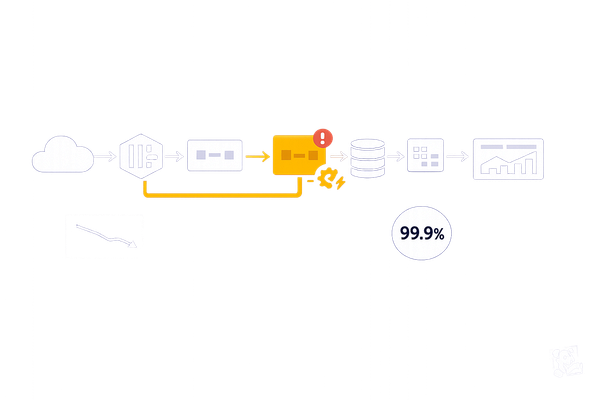
Want instant insights into your systems? Datadog APIs let you send metrics, logs, and events directly to the platform in real time - no agent required. This approach is perfect for modern setups like serverless architectures (AWS Lambda, Google Cloud Run) and helps you stay on top of performance issues before they escalate. Here's how Datadog APIs make monitoring easier:
- End-to-End Monitoring: Push data directly using RESTful endpoints (
/v1/seriesfor metrics,/v2/logs/eventsfor logs). - Custom Metrics: Track business-specific KPIs beyond standard integrations.
- Streamlined Authentication: Secure data with API and application keys.
- Error Handling: Retry mechanisms and dead letter queues ensure no data is lost.
- Scalability: Batch requests and use adaptive sampling to manage high volumes.
By following best practices - like batching data, tagging consistently (env, service, version), and monitoring API usage - you can build a scalable, efficient pipeline tailored to your needs. Whether you're troubleshooting logs or submitting deployment events, Datadog APIs offer flexibility for integrating with any system.
For SMBs, this means faster issue resolution, better observability, and reduced operational overhead. Ready to simplify your monitoring workflows? Let’s dive into the details.
Building a Real Time Metrics Database at Datadog
Prerequisites for Setting Up Real-Time Data Ingestion
Before you start ingesting real-time data with Datadog APIs, it's essential to set up authentication and the necessary tools. These steps ensure secure and efficient API requests, forming the backbone of your data ingestion process.
Understanding Datadog API and Application Keys
Datadog uses two types of keys to authenticate API requests, each serving a specific purpose:
- API Keys: These are organization-wide credentials used to send data - such as metrics, logs, and events - to Datadog. They are also critical for the Datadog Agent to function, acting as your organization’s identifier when submitting telemetry data.
- Application Keys: These work in tandem with API keys and are designed for more advanced operations like querying data or managing resources (e.g., dashboards or monitors). Unlike API keys, application keys are tied to the individual user who created them and inherit that user’s permissions. For production environments, using service accounts is recommended to ensure continuity.
Both keys must be included in the request headers as DD-API-KEY and DD-APPLICATION-KEY. You can manage these keys in the Organization Settings under their respective tabs. To maintain security, it’s a good idea to rotate the keys periodically, especially when a user with elevated permissions leaves the organization.
Required Tools and Permissions
To confirm that your API key is active, you can use a simple curl command like this:
curl -X GET "https://api.datadoghq.com/api/v1/validate" -H "DD-API-KEY: <YOUR_API_KEY>"
For more advanced workflows, Python is a great choice, and Datadog offers official client libraries to simplify development. To streamline your work, consider installing the Datadog plugin in your IDE, which provides access to documentation and allows you to test queries directly.
Make sure the user linked to your application keys has the necessary permissions. For example, if you’re managing logs, the user may need specific permissions like logs_read_data to verify that log data is flowing through your pipelines correctly.
For added security, store your keys as environment variables (e.g., DD_API_KEY) instead of hardcoding them. Additionally, ensure you’re using the correct API endpoint for your Datadog site - such as datadoghq.com for US1 or datadoghq.eu for EU regions - based on your account’s location.
How to Ingest Real-Time Metrics
Datadog Metric Types Comparison Guide for Real-Time Monitoring
This section explains how to submit real-time metrics using Datadog APIs.
Using the POST /v1/series Endpoint
The POST /v1/series endpoint is your go-to method for sending time-series data to Datadog. To use it, you'll need to include a JSON payload with a series array. Each element in this array defines the metric's data points, type, and tags. Don’t forget to include the DD-API-KEY header, and make sure your timestamps are in Unix format (in seconds) for precise tracking.
Here's an example of how to submit a gauge metric for CPU usage:
curl -X POST "https://api.datadoghq.com/api/v1/series" \
-H "Content-Type: application/json" \
-H "DD-API-KEY: <YOUR_API_KEY>" \
-d '{
  "series": [
    {
      "metric": "system.cpu.usage",
      "type": "gauge",
      "points": [[1736035200, 45.2]],
      "tags": ["environment:production", "host:web-server-01"]
    }
  ]
}'
If you're submitting count metrics, the structure remains the same, but set the type to count. You can also send multiple metrics in a single request by adding more objects to the series array. This approach minimizes the number of API calls, making the process more efficient.
Once you've set up your metrics, take a moment to understand the different metric types to ensure you're using the right one for your monitoring needs.
Comparing Metric Types
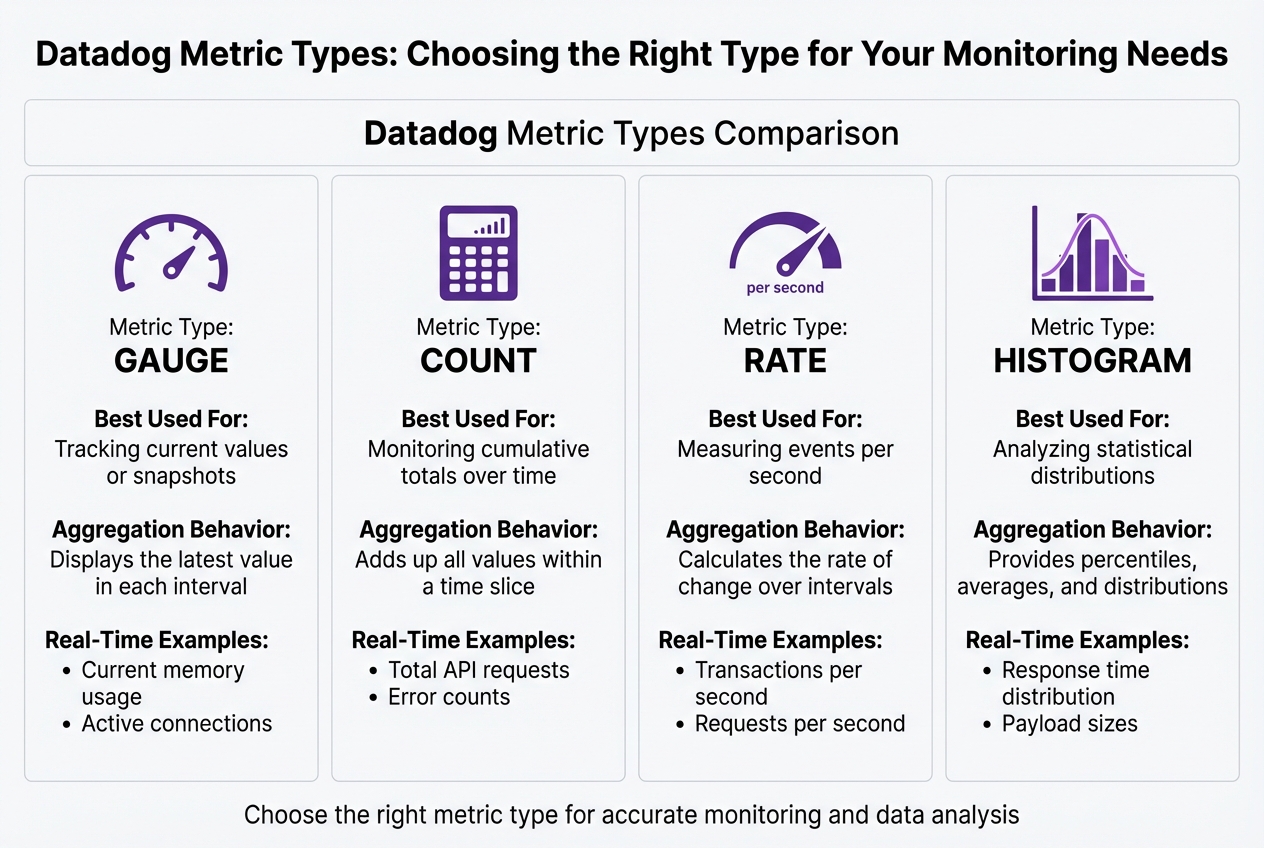
Choosing the right metric type is crucial for effective monitoring and accurate data analysis. Here's a quick comparison of the key metric types Datadog supports:
| Metric Type | Best Used For | Aggregation Behavior | Real-Time Example |
|---|---|---|---|
| Gauge | Tracking current values or snapshots | Displays the latest value in each interval | Current memory usage, active connections |
| Count | Monitoring cumulative totals over time | Adds up all values within a time slice | Total API requests, error counts |
| Rate | Measuring events per second | Calculates the rate of change over intervals | Transactions per second, requests per second |
| Histogram | Analyzing statistical distributions | Provides percentiles, averages, and distributions | Response time distribution, payload sizes |
Gauge metrics are perfect for tracking fluctuating values, like CPU usage, as they show only the most current value in a given interval. Count metrics, on the other hand, are better for accumulating totals, such as the number of processed requests or error occurrences.
Rate Limits and Optimization
Datadog applies rate limits to its Metrics API to maintain platform stability. The exact limits vary depending on your account type and can be found in your organization’s settings. To optimize your usage, batch metric submissions whenever possible to cut down on API calls.
If you encounter a 429 Too Many Requests error, it’s best to implement exponential backoff. This approach helps prevent overwhelming the API and ensures your metrics are submitted successfully.
Ingesting Real-Time Logs with Datadog
Logs capture system events, and sending them to Datadog in real time is crucial for diagnosing issues quickly. Using the Logs API, you can submit log entries as they happen, giving you instant insights into application behavior, errors, and performance.
Submitting Logs via POST /api/v2/logs/events
The POST /api/v2/logs/events endpoint allows you to send JSON-formatted payloads containing one or more log objects. To use it, include your API key in the DD-API-KEY header. Each log object must have a message attribute, along with standard fields that help Datadog categorize and process the logs efficiently.
Here’s a basic example of how to submit a log:
curl -X POST "https://http-intake.logs.datadoghq.com/api/v2/logs" \
-H "Content-Type: application/json" \
-H "DD-API-KEY: <YOUR_API_KEY>" \
-d '[
  {
    "message": "User login failed",
    "ddsource": "python",
    "service": "auth-api",
    "hostname": "web-server-01",
    "ddtags": "env:prod,version:2.1"
  }
]'
The ddsource field is key - set it to the technology generating the logs (e.g., nginx, python, java). Datadog uses this field to activate specific integrations, pipelines, and dashboards, reducing setup time. The ddtags field allows you to add metadata as a comma-separated string, which is useful for filtering logs in the Log Explorer. To ensure logs are ordered properly, format timestamps in ISO 8601 format or as a millisecond Unix epoch.
For efficiency, batch multiple logs into a single JSON array to minimize API calls. Once submitted, logs are processed immediately in Datadog's system.
Integrating Logs into Pipelines
After logs are ingested, they pass through pipelines configured in Datadog. These pipelines use filters based on attributes like ddsource, service, or tags to determine how logs are processed. Logs move sequentially through these pipelines, where various processors parse, enrich, and normalize the data before indexing.
The Grok Parser is especially useful for transforming unstructured logs into searchable key-value pairs. If your logs have custom formats, the Grok Parser can extract relevant details from the message string, making them easier to query and analyze.
Once parsed, Remappers help standardize your logs. For example:
- The Date Remapper ensures that the log's actual timestamp is used instead of the time it was received.
- The Status Remapper converts different log level formats (e.g., "err", "critical", "500") into Datadog’s standard severity levels, ensuring consistent alerting.
- The Service Remapper links logs to their corresponding APM service, enabling seamless correlation between logs and traces for faster troubleshooting.
To keep configurations manageable as your logging volume grows, use nested pipelines to organize logs by service or environment. Additionally, setting the ddsource attribute to match one of Datadog's 600+ integrations automatically activates pre-configured pipelines. This setup provides instant parsing and visualization, saving you time on manual adjustments.
Sending Events and Custom Data
Events in Datadog capture important moments like deployments, configuration changes, and alerts. By using the POST /api/v1/events endpoint, you can send these events directly to Datadog’s event stream. Once submitted, they appear in the Event Explorer, enabling real-time monitoring and analysis.
Using the POST /api/v1/events Endpoint
To submit an event, you’ll need to send a JSON payload that includes two key fields: title (a concise summary) and text (a detailed description). The text field supports Markdown, allowing you to include formatted links, code snippets, or troubleshooting instructions to help your on-call team respond more efficiently.
Here’s an example of submitting a deployment event:
curl -X POST "https://api.datadoghq.com/api/v1/events" \
-H "Content-Type: application/json" \
-H "DD-API-KEY: <YOUR_API_KEY>" \
-d '{
  "title": "Production deployment completed",
  "text": "Version 3.2.1 deployed to production. [View release notes](https://example.com/releases/3.2.1)",
  "tags": ["env:prod", "service:checkout-api", "version:3.2.1"],
  "alert_type": "success",
  "priority": "normal",
  "aggregation_key": "deploy-checkout-api-3.2.1"
}'
You can classify events by setting alert_type (e.g., error, warning, info, success) and priority (normal or low). This helps manage alert volume by marking high-frequency, non-critical events as low, ensuring they don’t overshadow more urgent alerts.
The aggregation_key field is especially useful for grouping related events. For example, if a service restart generates multiple health check failures, assigning them the same aggregation_key (e.g., "service-restart-checkout-api") consolidates them into a single timeline entry, reducing noise.
Once events are sent, Datadog’s Event Pipelines process them automatically. These pipelines can enrich, categorize, and standardize your data. For instance, remappers can normalize varied status formats, while the Category Processor can tag events based on their content. This seamless integration with Datadog’s monitoring workflows complements metric and log ingestion, ensuring a unified monitoring experience.
Best Practices for Events
To make your events more actionable and clear, follow these guidelines. Start with consistent tagging, which is essential for effective event management. Use unified service tags - env, service, and version - to link events with metrics, logs, and traces. This alignment is especially crucial during incidents, as it helps you quickly identify how changes like deployments or configuration updates impact system behavior across all telemetry.
Structure your tags in a key:value format. Tags like team:platform, region:us-east-1, or datacenter:dc-02 allow for faceted searches in the Event Explorer, making it easier for teams to filter and find relevant events. Including the source_type_name field (e.g., ansible, jenkins, kubernetes) provides immediate context about the tool that generated the event, helping responders act faster.
For events that need immediate attention, use the date_happened field with a POSIX timestamp. This ensures that events are placed accurately on the timeline, even if there are network delays during ingestion. When submitting error events, take advantage of Markdown in the text field to include direct links to diagnostic dashboards or log queries. This transforms your events into actionable insights, helping teams resolve issues faster and reduce downtime.
Best Practices for Real-Time Data Ingestion
To ensure your real-time data ingestion runs smoothly and efficiently, it's essential to focus on key practices like error handling, performance monitoring, and scalability. These strategies not only protect the integrity of your data but also help manage costs as your infrastructure grows.
Error Handling and Retry Strategies
One of the first steps is to make your ingestion pipeline idempotent. Assigning a unique identifier - such as a UUID or ULID - to every record sent to Datadog ensures that duplicate records won’t cause issues. Categorize errors to handle them effectively: use automatic retries with exponential backoff for temporary issues like network timeouts, and immediately address permanent problems like malformed payloads. For repeated failures, route them to a Dead Letter Queue (DLQ). Include critical metadata - like failure timestamps, source partitions, and error types - so you can investigate and reprocess these events later without losing valuable context.
If you encounter 429 (Too Many Requests) errors while scaling, implement exponential backoff in your retry logic, particularly for DLQ routing. This approach prevents overwhelming Datadog's API during traffic surges and reduces the risk of permanent data loss.
Monitoring API Performance
Keeping an eye on your ingestion pipeline’s performance is crucial. Track Agent rate limits and resource usage (CPU and memory) to catch problems early. Tools like Datadog's Endpoint Observability can help you monitor API response times and error rates, while usage metrics in the trace pipeline can pinpoint bottlenecks. If your Datadog Agent is using too many resources, it could delay data forwarding, creating a backlog that disrupts real-time visibility.
For trace data, focus on Usage Metrics within the trace pipeline to monitor ingestion volumes and identify potential issues. Pay attention to control headers in API responses, which can help you proactively throttle requests before hitting hard limits that might result in dropped data. These insights are vital for maintaining a broader observability strategy with Datadog.
Scaling for SMB Workflows
As your data volumes grow, adjust your ingestion strategy to handle the increase without compromising performance. Aggregating data at the source using DogStatsD is a great way to bundle metrics locally, cutting down on API calls and reducing overhead. This is especially effective in high-throughput environments where every API request can add latency and cost.
Use adaptive sampling and retention filters to manage ingestion rates during traffic spikes, ensuring you retain only the most critical telemetry data. Regularly review Usage Metrics to identify which services or resources are driving the most ingestion activity. This allows you to optimize where it matters most. Datadog's Metrics Without Limits feature can also help by letting you control which tags are indexed, giving you flexibility to manage cardinality and expenses.
Lastly, maintain consistent Unified Service Tagging (env, service, version) across metrics, traces, and logs. This consistency makes your data easier to search and correlate during incidents, while avoiding unnecessary tag combinations that could inflate costs. This streamlined approach not only simplifies troubleshooting but also keeps your operations running efficiently.
Conclusion
Using Datadog APIs for real-time data ingestion gives small and medium-sized businesses the tools they need to effectively monitor modern infrastructure. Whether it’s AWS Lambda functions, IoT telemetry, or custom KPIs, API-based ingestion ensures your critical data flows into Datadog seamlessly. By bypassing the need to manage agents in every environment, this method simplifies operations while delivering the unified visibility your team relies on for quick incident response.
Operational efficiency plays a key role in making real-time ingestion successful. By applying best practices - like batching requests, respecting rate limits, and implementing Unified Service Tagging - you can scale your monitoring efforts without running into unexpected costs. Consistent tagging with env, service, and version across all API-ingested data ensures smoother troubleshooting, especially for smaller teams managing diverse responsibilities.
As your infrastructure expands, staying scalable becomes a priority. Techniques like local aggregation and adaptive sampling, discussed earlier, can help optimize data throughput while keeping costs under control. Regularly monitoring API performance and usage metrics is also essential for identifying and resolving throttling issues before they lead to data gaps. These strategies are key to maintaining effective, scalable monitoring as your business grows.
With the rise of serverless and containerized architectures, API-driven ingestion is no longer optional - it’s essential. Securing your API keys, validating payloads, implementing error handling, and keeping an eye on your ingestion pipeline will help you build a monitoring system that grows with your business and keeps costs manageable. This approach sets the foundation for the proactive and efficient monitoring SMBs need to thrive.
For more insights and strategies tailored to SMB needs, check out Scaling with Datadog for SMBs.
FAQs
How do I securely authenticate when using Datadog APIs?
To keep your authentication with Datadog APIs secure, it’s crucial to use the right credentials and handle them with care. Datadog uses two types of keys: an API key to identify your account and an application key to manage request permissions. Think of these keys as passwords - they should be stored securely, such as in a secret manager or environment variables. Avoid hard-coding them into your source code, and make it a habit to rotate them regularly.
Always use HTTPS when making API calls to ensure your keys are encrypted during transmission. For an extra layer of security, you can enable IP allow-listing in the Access Control settings. This restricts access to your APIs to trusted IP addresses only. If you need user-specific access, like for CI/CD pipelines, take advantage of Datadog’s OAuth 2.0 flow. This method generates short-lived tokens that can be revoked without affecting other integrations.
For service-to-service communication, it’s a good practice to create service accounts with minimal permissions, adhering to the principle of least privilege. By combining HTTPS, scoped keys or tokens, regular key rotation, IP restrictions, and role-based service accounts, you can maintain secure and efficient workflows for your data ingestion.
How can I effectively manage API rate limits when using Datadog?
Managing API rate limits in Datadog is essential for smooth, real-time data ingestion. Start by keeping an eye on your usage through the X-RateLimit-* response headers. These headers help you monitor request volumes and stay within your allocated limits. To take it a step further, you can set up dashboards to visualize API activity and pinpoint any bottlenecks that might arise.
To cut down on unnecessary requests, focus on optimizing your API calls. This can include batching multiple operations into a single request, using pagination to fetch only the data you truly need, and caching frequently accessed results to avoid repetitive queries. If you run into rate-limit errors (HTTP 429), implement exponential backoff with retry logic. This means starting with a short wait after an error, then gradually increasing the delay for subsequent retries - while also capping the number of attempts to prevent overloading the API.
Another helpful tip is to leverage webhooks instead of continuously polling the API for updates. Webhooks allow Datadog to push event updates directly to you, reducing the need for constant API calls. By combining strategies like batching, caching, backoff, and webhooks, you can efficiently manage traffic and maintain reliable integrations. These practices are especially useful for SMBs looking to achieve high-performance data ingestion without exceeding Datadog's limits.
How can I select the right metric type for monitoring in Datadog?
Choosing the right metric type in Datadog depends on what you’re measuring and how you plan to analyze the data. Here’s a quick breakdown of the different types and when to use them:
- Count: Use this to track the total number of discrete events, like the number of requests served or errors logged, within a specific time frame. Counts are summed during the reporting interval, making them great for monitoring totals.
- Rate: Ideal for continuous events where you need a per-second value, such as transactions per second or bytes transferred. Datadog automatically converts counts into rates, making it easier to spot trends over time.
- Gauge: This is perfect for point-in-time measurements like CPU usage, memory consumption, or temperature. Gauges update with the latest value, giving you a real-time view of the current state.
- Distribution: Choose this for capturing statistical insights, such as request latency or payload sizes. Datadog processes these into histograms, providing averages, medians, percentiles, and more, which is especially useful for spotting outliers.
To pick the right metric, think about whether your data reflects a total count, a rate, a current state, or if it needs deeper statistical analysis. Once you’ve identified the type, set it up in Datadog for precise monitoring. For more specific guidance, explore the Datadog guide tailored for small and medium-sized businesses.